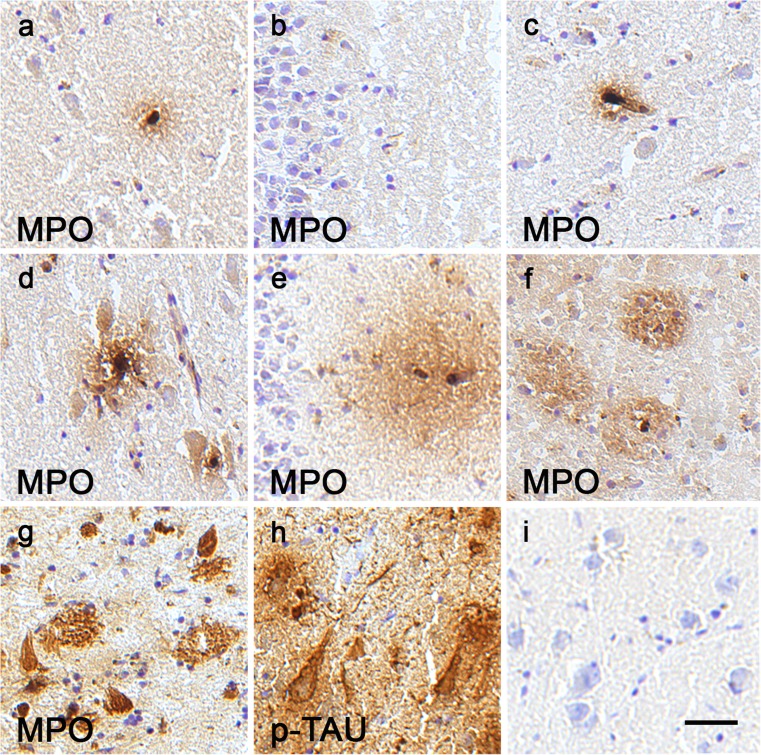
Fig. 4.
MPO expression in hippocampus from AD patients and control cases. Examples of MPO-immunoreactive cells in the CA1 region (a), dentate gyrus (b) and entorhinal cortex (c) of a control case and in the CA1 region (d), dentate gyrus (e) and entorhinal cortex (f) of an AD patient. Some “ghost tangles” are shown scattered between MPO-immunoreactive amyloid plaques in the CA1 region of an AD case (g). Similar cells on the adjacent section are ir for tau (p-TAU; h). A negative control for the staining protocol is shown in i. Bar 25 μm

