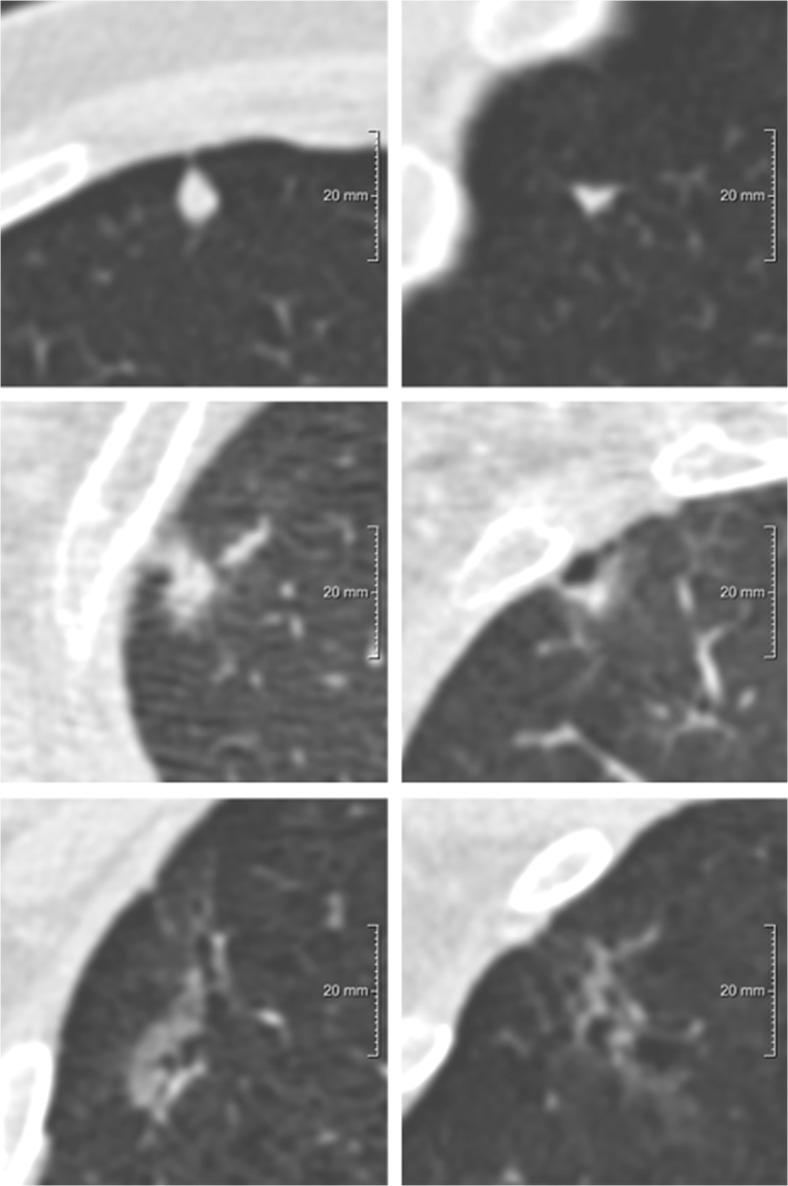
Fig. 3.
Examples of nodules with variation between the longest diameter, mean diameter based on volumetry, and mean of longest and perpendicular diameter. Each row depicts a nodule, displayed in the axial (left) and coronal (right) plane and centered in the images with a field of view of 60 x 60 mm. (A) Benign solid nodule with Dlongest-C 7.8 mm, Dmean3D 5.3 mm, DmeanAxial 6.3 mm; (B) Malignant part-solid nodule with Dlongest-C of total nodule 16.6 mm and of solid component 13.3 mm, Dmean3D of total nodule 12.3 mm and of solid component 7.4 mm, DmeanAxial of total nodule 15.0 mm and of solid component 10.6 mm; (C) Benign pure ground-glass nodule with Dlongest-C 20.6 mm, Dmean3D 13.0 mm, DmeanAxial 17.0 mm

