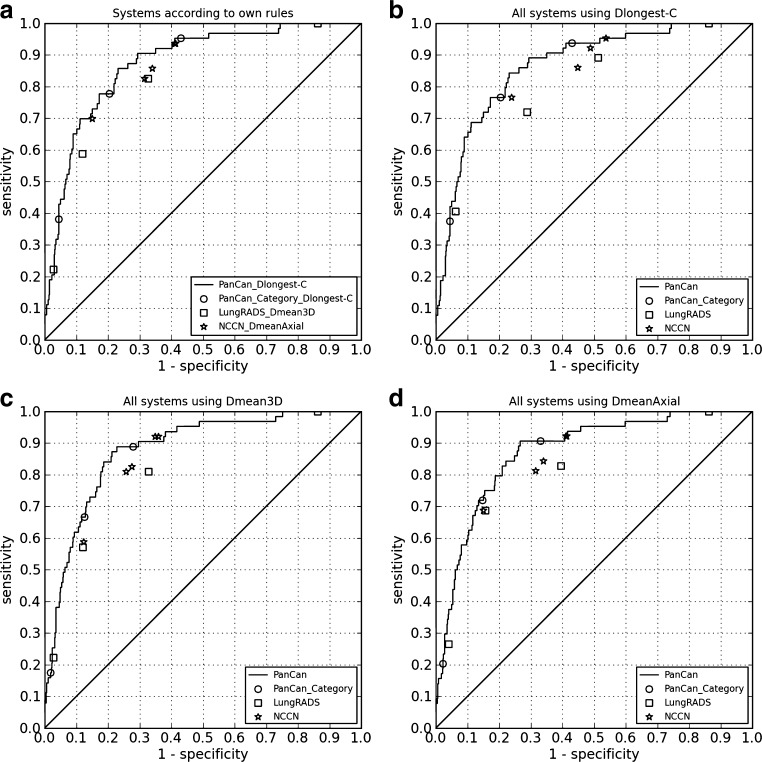
Fig. 4.
Performances of the PanCan model, Lung-RADS and the NCCN guidelines are illustrated in ROC curves. In all figures, the PanCan model is shown as a continuous curve based on the continuous nodule risk indexes and as operating points based on the categories for nodule risk index scores, similar to the Lung-RADS and NCCN categories. (A) All systems are visualized using their own nodule size diameter definitions, with Dlongest-C for the PanCan model; (B) All systems are visualized using Dlongest-C as nodule size definition; (C) All systems are visualized using Dmean3D as nodule size definition; D: All systems are visualized using DmeanAxial as nodule size definition

