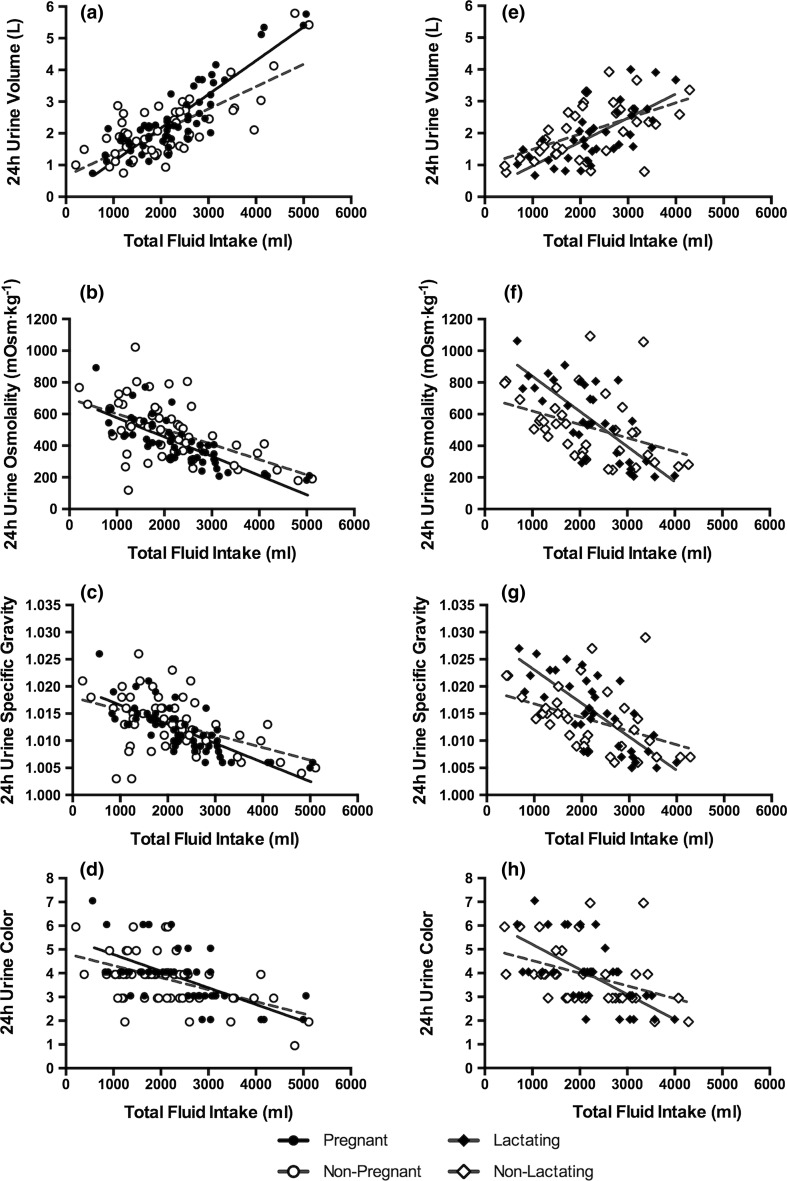
Fig. 3.
Relationships between TFI and urinary hydration biomarkers. A significant relationship existed between TFI and all urinary hydration biomarkers in all groups. Solid lines reflect the trend line for the relationship in PREG–LACT; dotted lines reflect the trend line for the relationship in NP–NL (all visits combined). The slope of the regression line in PREG was significantly different from NP for the relationship between 24-h U VOL and TFI within visit (F = 4.11, P = 0.0047, see a), with the difference occurring at visit 3 (t = 3.38, P = 0.0017). The relationship between TFI and 24-h U SG was also significantly different between PREG and NP (F = 2.56, P = 0.0441), but no post hoc differences were identified after accounting for the number of comparisons

