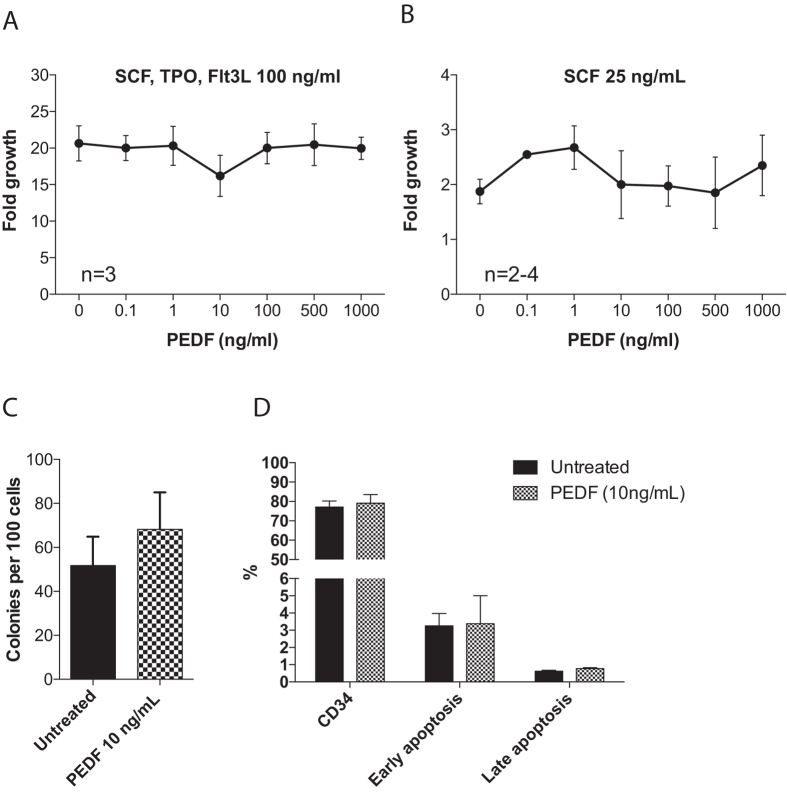
Figure 5.
Dose response curve for recombinant human PEDF in human HSPCs. PEDF-dose response curve for CD34 + cord blood cells. (A) Cells were cultured in SFEM media supplemented with SCF, TPO and Flt3L, all cytokines in 100 ng/ml with or without recombinant human PEDF at given concentrations (n = 3). (B) CD34 + cells were cultured in SFEM supplemented with 25 ng/ml SCF with or without recombinant human PEDF at given concentrations (n = 2–4). (C) After five days of culture with or without recombinant PEDF in SFEM media (supplemented with SCF, TPO and Flt3L) cells were plated in methylcellulose media. Graph shows number of colonies per 100 cells plated (n = 4). (D) Graph shows percentage of cells expressing CD34 or apoptotic markers after five days of culture in SFEM (supplemented with SCF, TPO and Flt3L) (n = 2). Results shown are the mean ± SEM.

