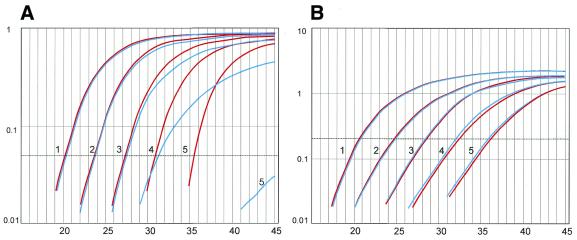
Figure 4.
Quantification of NF1Δ37 using a boundary spanning probe (A) or a boundary spanning primer (B). (A) Equal amounts of water (red curves) or NF1+37 (blue curves) were added. Equal Ctvalues are obtained for the first three dilutions. Influence on amplification efficiency from the presence of full-length transcript is already observed for dilution 4 by a reduction of end-point fluorescence and an increase in Ctvalue for the blue curve. At higher Ctvalues quantification is no longer reliable as can be seen for the Ct difference between dilutions 5. (B) No difference is seen between the series with the addition of water (red) and NF1+37 (blue).

