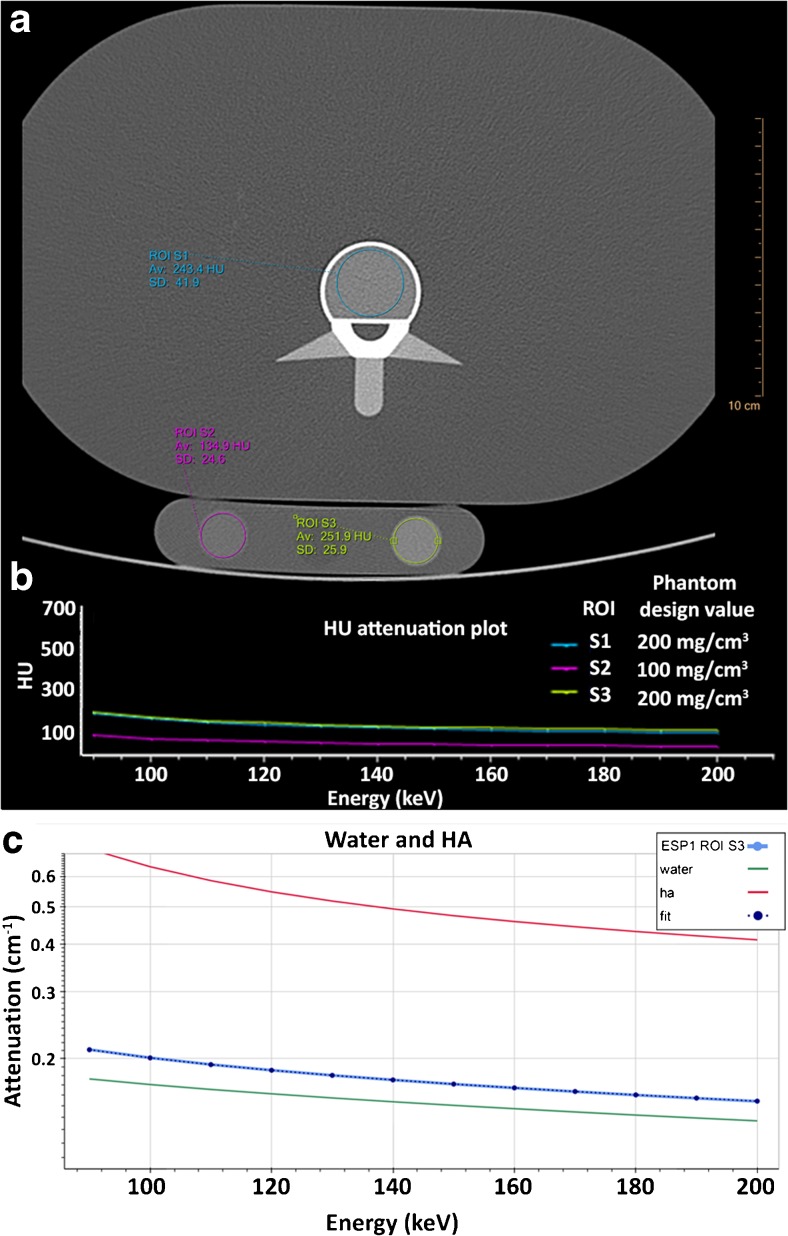
Fig. 2.
Image analyses and bone mineral density quantification. (A) Axial image with a ROI drawn in the ESP (blue) and BDC (pink and green). (B) Spectral plot for the corresponding ROIs: mean HU versus monochromatic energy level (keV). (C) Attenuation profiles were constructed between 90 and 200 keV in steps of 10 keV. Using in-house developed software, HA concentrations were calculated by fitting the constructed profiles to known attenuation profiles of pure HA and pure water. For this image this concerns ROI S3, an insert with a phantom design value of 200 mg/cm3 HA concentration. Av average, BDC bone density calibration phantom, ESP European spine phantom, HA calcium hydroxyapatite, HU Hounsfield units, keV kilo electron voltage, ROI region of interest, SD standard deviation

