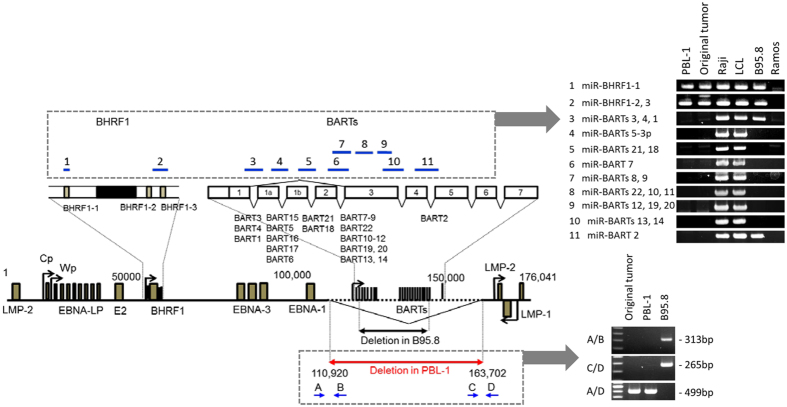
Figure 2.
Deletion of EBV genome in PBL-1. Genetic map of EBV is shown (left). Deleted region of PBL-1 is indicated by the red arrow. Deleted region in B95.8 EBV is indicated by the lower black arrow. The right panels show results of PCR analysis for EBV DNA encoding BHRF1 and BART miRNA clusters (upper panel), and PCR of the deletion site of EBV in PBL-1 (lower panel). Upper blue lines in the EBV genetic map indicate PCR amplicons for EBV DNA encoding miRNAs in the right upper panel. Lower blue arrows in EBV genetic map are PCR primers used for PCR analysis of the breakpoint (right lower panel).

