
Figure 7.
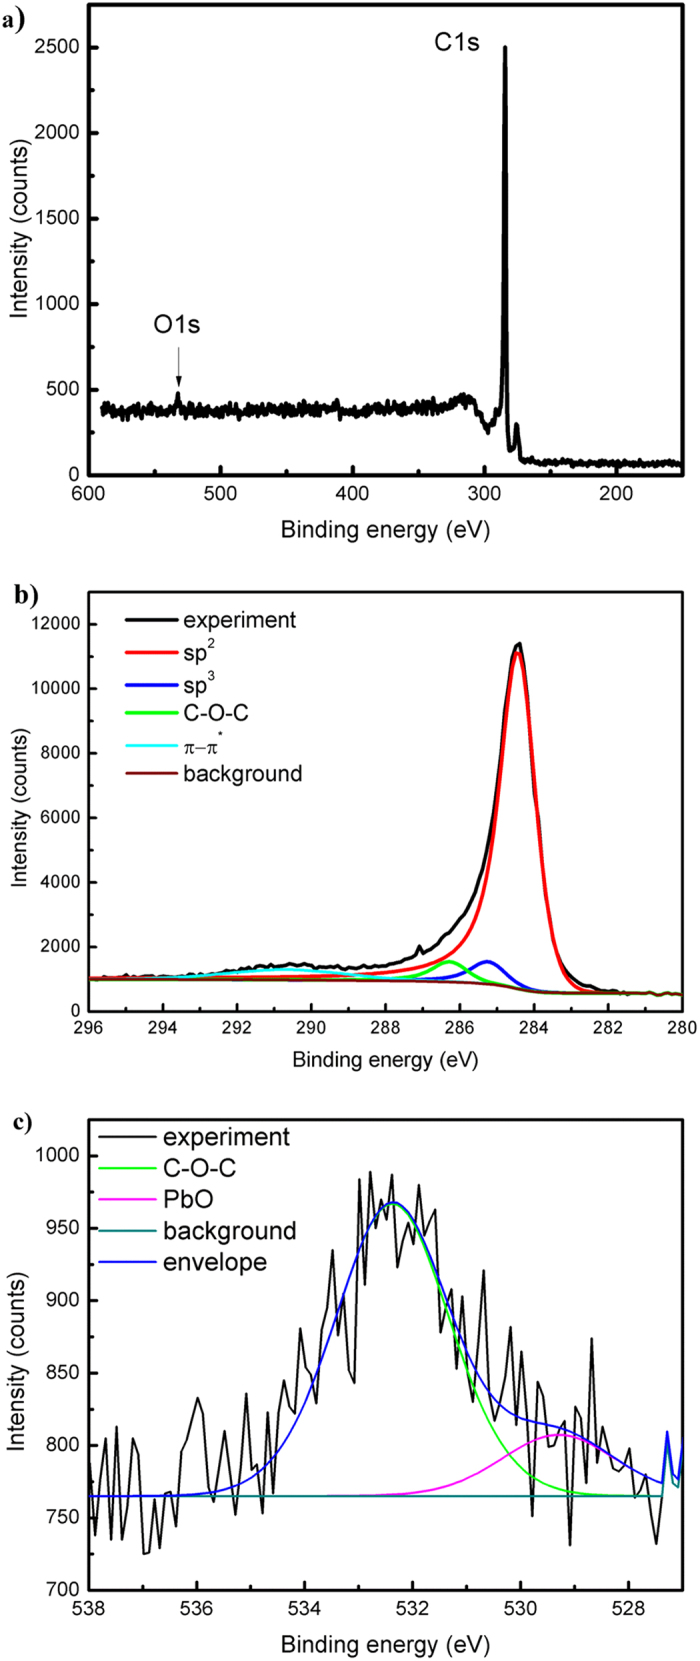
(a) XPS survey spectra of the sample obtained at P = 2 KW; QAr = 1200 sccm; QEt = 26 sccm; Twall = 150 °C, UV radiation applied; (b) detailed C 1s region with corresponding fitting; (c) detailed O 1s region with corresponding fitting.
Official websites use .gov
A
.gov website belongs to an official
government organization in the United States.
Secure .gov websites use HTTPS
A lock (
) or https:// means you've safely
connected to the .gov website. Share sensitive
information only on official, secure websites.
(a) XPS survey spectra of the sample obtained at P = 2 KW; QAr = 1200 sccm; QEt = 26 sccm; Twall = 150 °C, UV radiation applied; (b) detailed C 1s region with corresponding fitting; (c) detailed O 1s region with corresponding fitting.