
Figure 3.
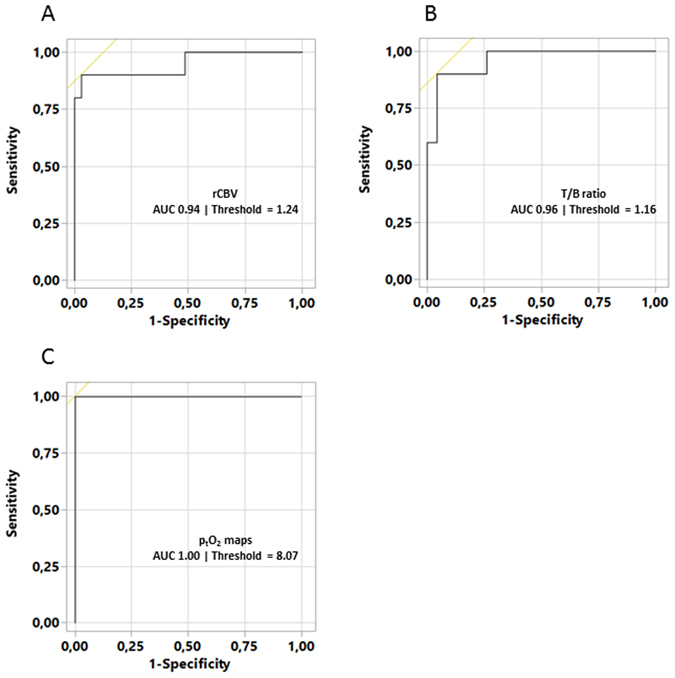
ROC curve analyses for discrimination of GBM and nGBM) using rCBV (A), T/B ratio maps (B) and affined ptO2 maps (C). The AUC and ROC threshold (for best sensitivity and specificity) values are reported in each ROC histogram.
Official websites use .gov
A
.gov website belongs to an official
government organization in the United States.
Secure .gov websites use HTTPS
A lock (
) or https:// means you've safely
connected to the .gov website. Share sensitive
information only on official, secure websites.
ROC curve analyses for discrimination of GBM and nGBM) using rCBV (A), T/B ratio maps (B) and affined ptO2 maps (C). The AUC and ROC threshold (for best sensitivity and specificity) values are reported in each ROC histogram.