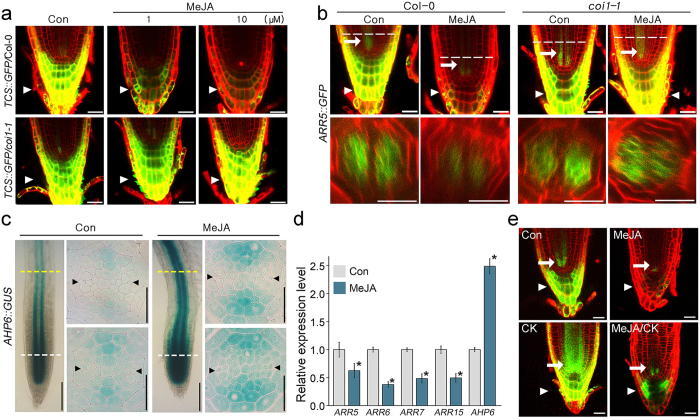
Figure 3.
JA reduces the cytokinin response. (a) Effect of JA on the cytokinin response was analyzed by visualizing the fluorescent signals in TCS::GFP/Col-0 (top) and TCS::GFP/coi1-1 (bottom) plants grown in 1 and 10 μM MeJA for 7 days. (b) Confocal longitudinal (top) and cross (bottom) section images showing that JA suppressed cytokinin-induced ARR5 expression in root vascular tissues of Col-0, but not in coi1-1 mutants. The indicated plants were grown in 10 μM MeJA or not treated for 7 days. (c) GUS staining of AHP6::GUS plants grown in 10 μM MeJA or not treated for 7 days using GUS staining solution without ferrocyanide/ferricyanide. (d) Expression levels of cytokinin-responsive genes measured by qRT-PCR. Total RNA was extracted from Col-0 roots grown in the indicated conditions for 7 days. GAPDH was used as a reference gene for normalization. Error bars represent S.D. and asterisks indicate statistically significant differences between the corresponding samples and their control (p < 0.01, t-test). (e) Visualization of the fluorescent signals in ARR5::GFP/Col-0 grown in the indicated conditions (MeJA, 10 μM MeJA; cytokinin, 50 nM BAP; MeJA/cytokinin, 10 μM MeJA and 50 nM BAP). White arrows and arrowheads indicate cytokinin response in the vascular tissue and root cap, respectively. Dotted lines indicate the longitudinal position where confocal optical cross-sectioning was performed. Scale bar = 100 μm in whole-mounted images of (c) and 20 μm in others.

