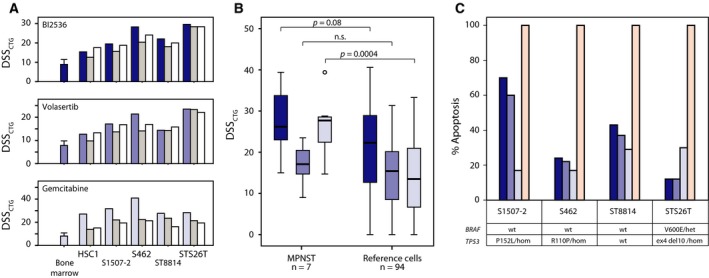
Figure 3.

Independent validation and apoptosis assay of MPNST‐specific drugs. Comparison of drug sensitivity scores from initial (blue bars, including average data and standard deviation for the five bone marrow samples) CellTiter‐Glo viability assay (DSSCTG), and two subsequent validation rounds [manual (medium gray bars); custom plate (white bars)] (A). DSSCTG obtained for the three drugs BI2536 (dark blue), volasertib (medium blue), and gemcitabine (light blue) from MPNST cell lines in comparison with a reference set of 94 cancer cell lines (colon, ovarian, and leukemia); two‐tailed P‐values from independent samples t‐test, assuming unequal variance (B). The maximum level of apoptosis measured by a luminescence‐based caspase‐3/7 activation assay, induced by BI2536 (dark blue), volasertib (medium blue), and gemcitabine (light blue), in comparison with staurosporin (100% apoptosis, pink) and 0.1% DMSO (0% apoptosis) (C). The mutation status of TP53 and BRAF in each cell line is shown (het—heterozygous; hom—homozygous).
