Figure 1.

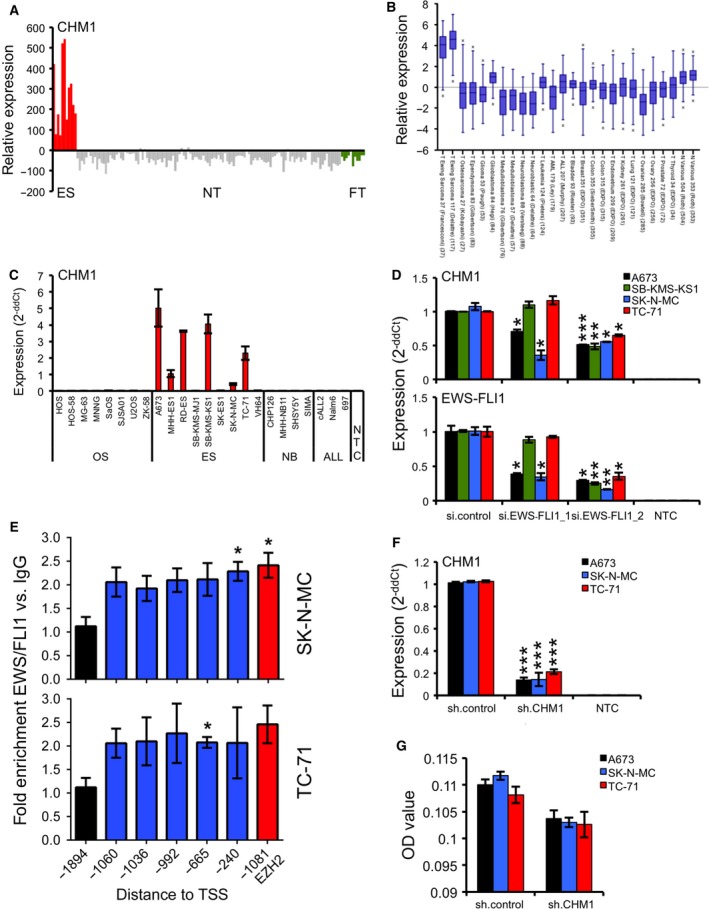
CHM1 is highly overexpressed in ES. (A) Expression profile of CHM1 in primary ES in comparison with normal tissue (NT) and fetal tissue (FT). ES, NT, and FT samples were analyzed using EOS‐Hu01 microarrays (Staege et al., 2004). (B) Expression levels of CHM1 in different pediatric small, round, blue cell tumors, carcinomas, and normal tissues by box plot presentation using a comparative study of the amc onco‐genomics software tool (www.amc.com). Results are 2‐log‐centered for better representation of results. The number of samples in each cohort is given in brackets. (C) CHM1 expression in different tumor cell lines analyzed by qRT‐PCR. Data are mean ± SEM. (D) RNA interference of EWS‐FLI1 expression (bottom) does reduce CHM1 expression (top). si.EWS‐FLI1_1 (less efficient) and si.EWS‐FLI1_2 represent the specific siRNAs (si.control: nonsilencing siRNA). Results of qRT‐PCR 48 h after transfection are shown. Data are mean ± SEM of two independent experiments; t‐test. (E) EWS‐FLI1 enrichment at the CHM1 promoter in SK‐N‐MC and TC‐71 cells. ChIP analysis was performed with FLI1 and control IgG antibodies, respectively, and analyzed by quantitative PCR for binding to different regions of the CHM1 promoter. FLI1 enrichment was detected at different ETS recognition sites −1060, −1036, −992, −665, and −240 bp upstream of the TSS of CHM1. The −1894‐bp region, which is devoid of ETS recognition sequences, served as negative control. The ETS consensus site at −1081 bp of the EZH2 promoter (Richter et al., 2009) was used as positive control for FLI1 binding. Data represent the mean of two independent experiments, and error bars represent standard deviations. (F) Constitutive suppression of CHM1 expression after infection of ES cells with CHM1‐specific shRNA constructs as measured by qRT‐PCR (sh.CHM1 and sh.control). qRT‐PCR data are mean ± SEM of 10 independent experiments; t‐test. (G) ELISA detection of CHM1 levels in the supernatant of ES cells stably transfected with CHM1 shRNA or control. Data are mean ± SEM; t‐test. *P < 0.05; **P < 0.005; ***P < 0.0005 (see 2.15. Statistical analyses).
