Figure 2.

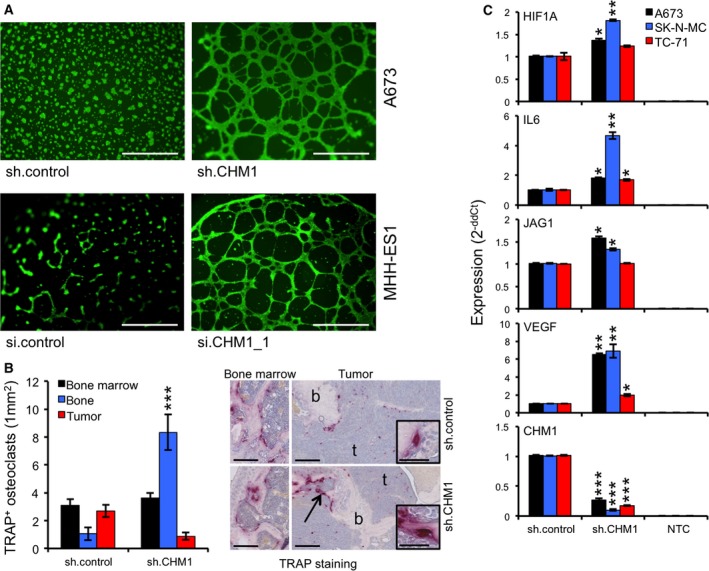
CHM1 inhibits tube formation and influences osteomimicry. (A) Tube formation assay with constitutively transfected A673 (sh.control and sh.CHM1) and transiently transfected MHH‐ES1 (si.control and si.CHM1_1) cells demonstrated CHM1 to clearly inhibit endothelial differentiation potential (scale bar 0.5 mm). (B) Analysis of osteolysis of A673 sh.CHM1 and negative controls (sh.control) in an orthotopic bone xenotransplantation model (five to eight mice per group). Affected bones were assessed by histology (TRAP staining, scale bar 0.25 mm or 0.05 mm). Left panel: quantitative summary of the average number of osteoclasts (mm2) in unaffected bone marrow, tumor samples, and attached to the bone in tumor tissues (bone). Data are mean ± SEM of at least two independent samples (at least 40 segments counted); t‐test. Right panel: Representative pictures are shown. CHM1 knockdown significantly enhanced the amount of TRAP‐positive osteoclasts attached to the bone (b) in the area of tumor (arrow) and thus increased the osteolytic phenotype. (C) Different ES cell lines with constitutive CHM1 knockdown and respective controls were analyzed by qRT‐PCR for expression of osteolytic genes such as HIF1A,IL6,JAG1, and VEGF. Data are mean ± SEM of two independent experiments; t‐test. *P < 0.05; **P < 0.005; ***P < 0.0005 (see 2.15. Statistical analyses).
