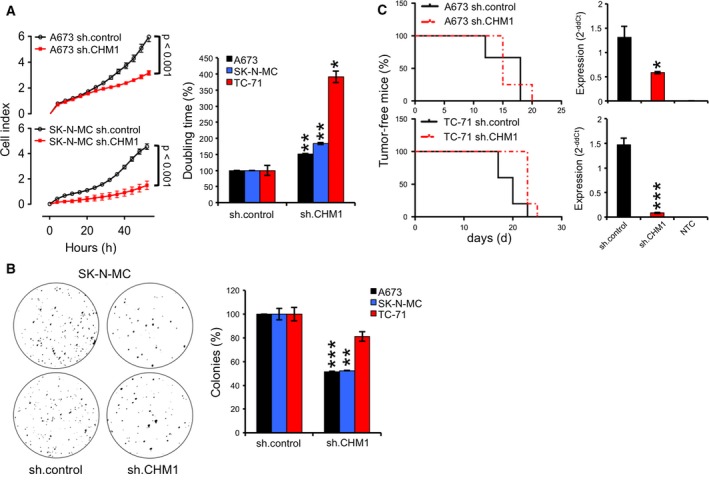
Figure 3.

CHM1 delayed proliferation in ES in vitro. (A) Analysis of contact‐dependent growth of constitutively sh.CHM1‐ and sh.control‐infected ES cell lines with xCELLigence. Left panel: Cellular impedance was measured every four hours (relative cell index). Data are mean ± SEM (hexaplicate/group); t‐test. Right panel: doubling time of constitutive A673, SK‐N‐MC, and TC‐71 CHM1 shRNA infectants. Data are mean ± SEM of two independent experiments/cell line (hexaplicate/group); t‐test. B. Effect of CHM1 knockdown on anchorage‐independent growth in A673, SK‐N‐MC, and TC‐71 cells using methylcellulose matrices. Left panel: A representative experiment with SK‐N‐MC cells was shown as macrograph. Right panel: The average number of colonies of at least two different experiments with three different ES cell lines was shown after stable CHM1 suppression. (C) Left panel: evaluation of tumorigenicity of constitutive A673 and TC‐71 CHM1 shRNA infectants in immunodeficient Rag2−/−γc−/− mice (3–5 mice per group). Right panel: post ex vivo CHM1 expression using qRT‐PCR. Data are mean ± SEM, t‐test. *P < 0.05; **P < 0.005; ***P < 0.0005 (see 2.15. Statistical analyses).
