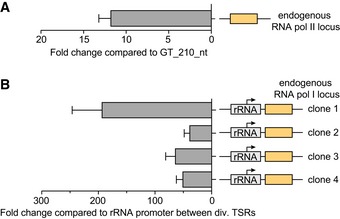
Figure EV3. Endogenous expression levels.

- Luciferase activity expressed from an endogenous RNA pol II locus within a PTU compared to luciferase activity induced by GT_210_nt between dTSRs. To normalize for differences in cell number, Fluc activity was normalized to ectopically expressed Renilla luciferase activity.
- Luciferase activity induced by an rRNA promoter at an endogenous RNA pol I locus within the rDNA spacer region compared to the luciferase activity induced by an rRNA promoter located between dTSR. To normalize for differences in cell number, Fluc activity was normalized to ectopically expressed Renilla luciferase activity.
