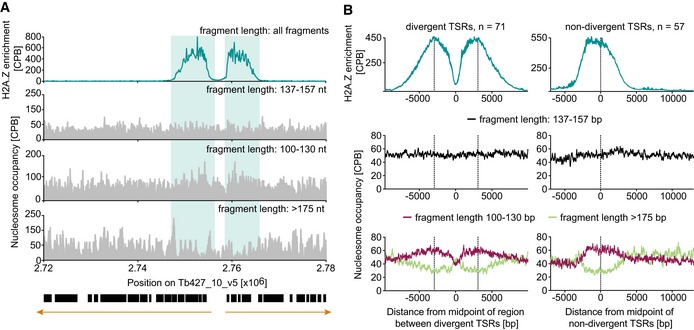
Figure 4. TSRs exhibit increased MNase sensitivity.

- MNase‐ChIP‐seq data of H2A.Z‐containing mononucleosomes and total mononucleosomes (nucleosome occupancy) grouped based on size of digestion products (for outline, see Fig EV5). Black boxes represent open reading frames. Orange arrows indicate the direction of transcription. Shown is a representative TSR of chr. 10.
- The enrichment of H2A.Z and total nucleosome occupancy averaged across all divergent TSRs (left panel) and non‐divergent TSRs (right panel) are plotted relative to the midpoint of the region between the TSRs and the TSR center, respectively. Dashed lines mark the respective TSR centers.
