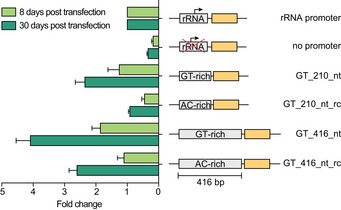
Figure EV4. Luciferase activity increases over time.

Luciferase assays were performed 8 and 30 days post‐transfection. To account for differences in cell number, Fluc activity was normalized to ectopically expressed Renilla luciferase activity. To account for technical variations, values were normalized to rRNA promoter‐driven Fluc activity. Data are presented as mean ± SD. Error bars indicate standard deviation between two replicates.
