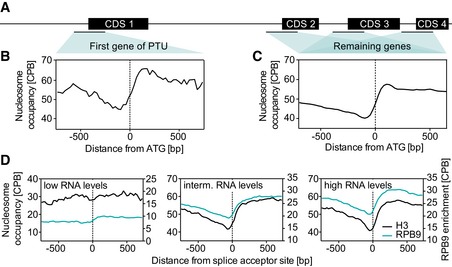
Figure 5. Nucleosome depletion correlates with the level of gene expression.

- Schematic display of a PTU.
- Nucleosome occupancy is plotted relative to the start codon (ATG) of the first gene of a PTU and averaged across all PTUs (n = 184). The definition of the first gene of a PTU is based on a previous study (Kolev et al, 2010) and genome version Tb927v24.
- Total nucleosome occupancy is plotted relative to the ATG and averaged across all genes except the first gene of a PTU (n = 12,220).
- Nucleosome occupancy is plotted relative to the splice acceptor sites and averaged across the 25% of genes containing the highest RNA levels (left panel, n = 690), the 25% of genes containing intermediate RNA levels (middle panel, n = 690), and the 25% of genes containing the lowest RNA levels (lower panel, n = 690). RNA levels were determined previously (Fadda et al, 2014).
