-
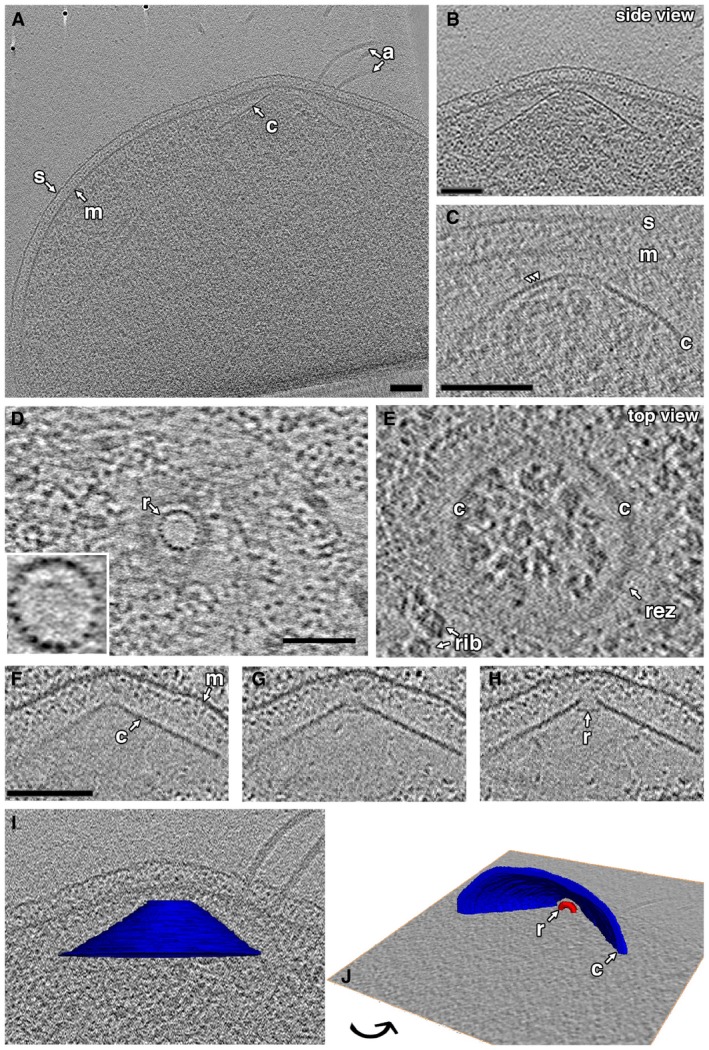
A, B
A tomographic slice shows a side view of a conical structure (c) in the cytoplasm, rotated and enlarged in (B).
-
C
A tomographic slice shows a side view of the cone in another cell, highlighting the subunit texture along the edge of the cone (arrowheads).
-
D, E
Top views of a cone at different heights show the inner ring (r; enlarged in inset to highlight 19‐subunit structure) and outer cone.
-
F–H
Sequential slices through a side view of a cone in a lysed cell show the relative location of the ring in the cone.
-
I, J
Different views of a 3D segmentation of the cone shown in (A), embedded in a tomographic slice.
Data information: s, S‐layer; m, membrane; a, archaella; rib, ribosomes; rez, ribosome‐excluding zone. Scale bars, 100 nm; scale bar in (D) applies to (D, E); scale bar in (F) applies to (F–H); segmentation not to scale.