
Figure EV1. YAP and TEAD directly promote Skp2 transcription in response to mechanical cues.
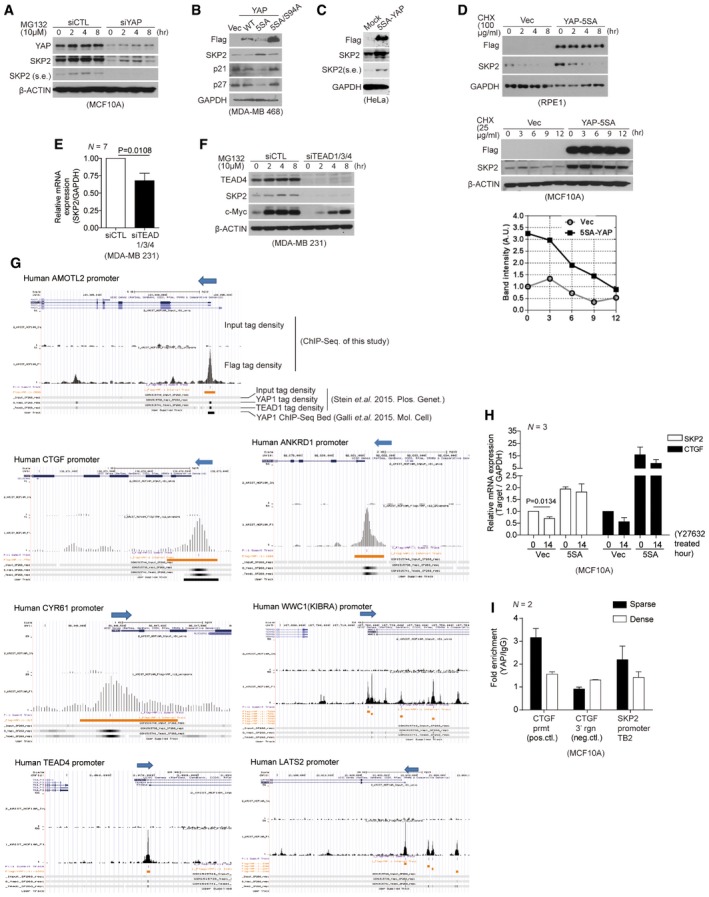
- Immunoblots with the indicated antibodies. At the indicated time points, whole‐cell lysates were taken from MCF10A cells transfected with the indicated siRNAs and treated with MG132 (10 μM).
- Immunoblots of MDA‐MB‐468 cells infected with retroviruses encoding an empty vector (Vec) or the indicated YAP mutant clones.
- Immunoblots of HeLa cells transduced with flag 5SA‐YAP via retroviral infection.
- Immunoblots of RPE1 (above) or MCF10A cells (below) stably expressing vector or 5SA‐YAP and incubated with cyclohexamide (CHX) for the indicated times. Relative Skp2 immunoblot band intensity normalized to β‐actin is also shown for MCF10A cells.
- Relative mRNA levels of the indicated genes, as determined by qPCR, from MDA‐MB‐231 cells transfected with control siRNAs or TEAD1/3/4‐specific siRNAs. Data were collected from seven independent experiments (N = 7).
- MDA‐MB‐231 cells were transfected with control siRNAs or TEAD1/3/4‐specific siRNAs. After 48 h, the cells were treated with MG132 (10 μM). Shown are immunoblots from whole‐cell lysates prepared at the indicated times with the indicated antibodies.
- Relative Skp2 and CTGF mRNA levels, as measured by qPCR, in MCF10A cells stably expressing vector or 5SA‐YAP and treated with Y27632 (20 μM, 14 h) or not (N = 3).
- Enrichment of endogenous YAP at TB2 in the Skp2 promoter in MCF10A cells cultured as sparse or highly dense monolayers, as determined by ChIP‐qPCR. The CTGF promoter (prmt) and the genomic region 3′ of the CTGF gene were used as positive (pos.ctl) and negative controls (neg.ctl), respectively (N = 2).