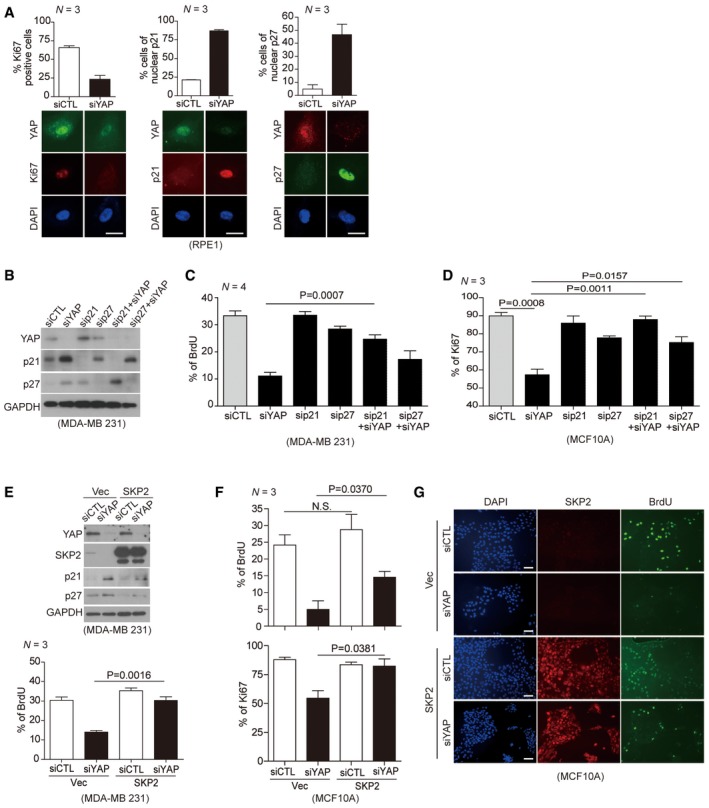
(Above) Quantification of Ki67‐, p21‐, or p27‐positive cells among control and YAP‐depleted cells. > 150 cells were analyzed for each of three independent experiments. (Below) Representative immunofluorescence images of RPE1 cells transfected with control siRNAs or YAP‐specific siRNAs and stained with the indicated antibodies. DAPI was used as a nuclear counterstain. Scale bars: 20 μm.
Immunoblots of MDA‐MB‐231 cells transfected with the indicated siRNAs.
BrdU incorporation assays (1 h) on cells prepared as in (B). BrdU status was determined via immunofluorescence with a BrdU‐specific antibody and DAPI staining. > 600 cells were analyzed for each of four independent experiments.
MCF10A cells prepared as in (B). Ki67‐positive cells were quantified by immunofluorescence with a Ki67‐specific antibody and DAPI staining. > 500 cells were analyzed in each of three independent experiments.
(Above) Immunoblots of whole‐cell lysates from MDA‐MB‐231 cells 2 days after transduction with either vector or Skp2 lentiviruses and then transfection with either control siRNAs or YAP‐specific siRNAs. (Below) BrdU incorporation assays (1 h) on cells prepared as described above. > 600 cells were analyzed for each of three independent experiments.
MCF10A cells expressing either vector or Skp2 were transfected with the indicated siRNAs. After 1 h of BrdU incorporation, BrdU‐ and Ki67‐specific antibodies were used to quantify BrdU‐ or Ki67‐positive cells. > 400 cells were analyzed for each of three independent experiments.
Representative images for (F). Scale bars: 50 μm.
Data information: All error bars indicate standard error of the mean (s.e.m.) for
N independent experiments. Statistical significance, as determined by a two‐tailed
t‐test, is indicated above each bar.

