-
A
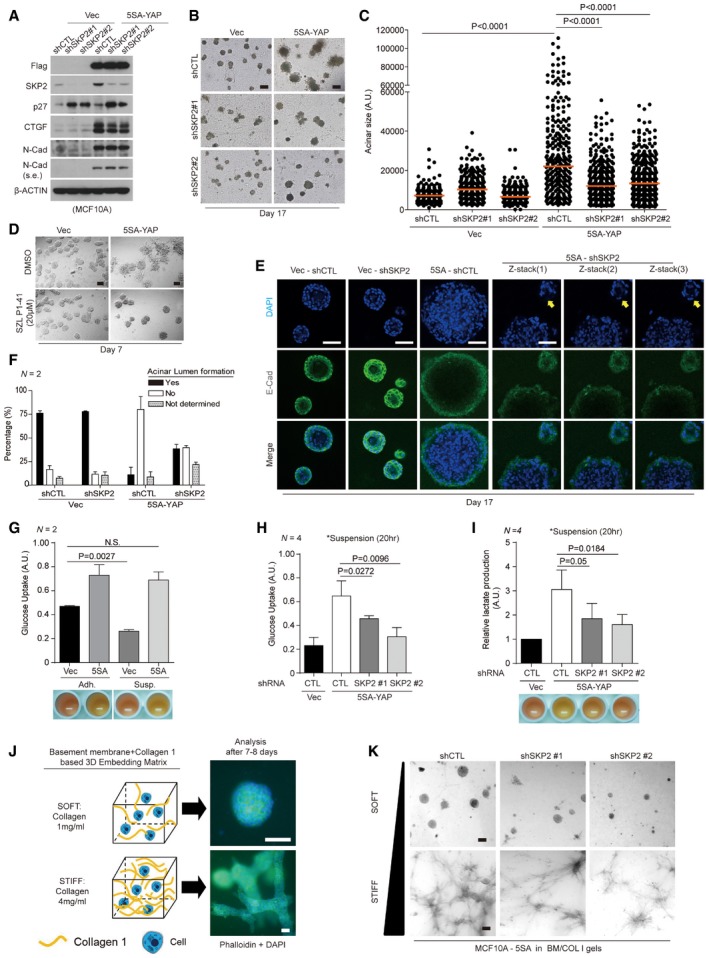
Immunoblots of MCF10A cells expressing vector or 5SA‐YAP and transduced with the indicated shRNA lentiviruses.
-
B
Mammary acini formation in MCF10A cells as in (A) grown on 3D Matrigel. After 17 days, acini were fixed and imaged using phase contrast microscopy. Images representative of two independent experiments are shown. Scale bars: 100 μm.
-
C
Quantification of individual acinar size for (B). Orange bars indicate the median. > 250 acini were analyzed for each of two independent experiments.
-
D
Mammary acini formation by MCF10A cells expressing vector or 5SA‐YAP and treated with dimethylsulfoxide (DMSO) or the Skp2 inhibitor SZP P1‐41 (20 μM). Acini were treated as in (B). Images representative of three independent experiments are shown. Scale bars: 50 μm.
-
E
Acini formed as in (B) immunostained with an E‐cadherin‐specific antibody (E‐Cad) and counterstained with DAPI. Representative single confocal images or serial Z‐stacks. Yellow arrows indicate lumen formation. Scale bars: 50 μm.
-
F
Acinar lumen formation as determined by analysis of serial Z‐stacks from (E). Irregular acini with ambiguous lumens were classified “Not determined”. Error bars indicate s.e.m. > 30 acini were analyzed for each of two independent experiments.
-
G
(Above) Glucose uptake was measured in adherent (Adh.) or suspended (Susp.) MCF10A cells expressing control or 5SA‐YAP using the Glucose Assay (GO) kit. (Below) Image depicting the color of the medium from cultures of the indicated cells.
-
H, I
Control or 5SA‐YAP‐expressing MCF10A cells infected by the indicated shRNA lentiviruses were suspended. After 20 h, glucose uptake (H) and lactate concentration (I) in the indicated cells were measured. Representative images depicting the color of the medium from cultures of the indicated cells (I, below).
-
J
Schematic depicting the basement membrane (BM; Matrigel) and collagen 1 (COL1)‐based BM/COL1 3D soft and stiff matrices as well as representative phalloidin‐stained images of MCF10A cells grown in each of them. Scale bars: 50 μm.
-
K
5SA‐YAP‐expressing MCF10A cells infected by the indicated shRNA lentiviruses were embedded in soft or stiff 3D BM/COL1 gels. After 7–8 days of growth, the cells were imaged by phase contrast. Images representative of four independent experiments are shown. Scale bars: 100 μm. See Fig
EV4C.
Data information: All error bars indicate standard error of the mean (s.e.m.) from
independent experiments. The significance, as determined by a two‐tailed
‐test, is indicated above each bar. N.S. indicates non‐significance.