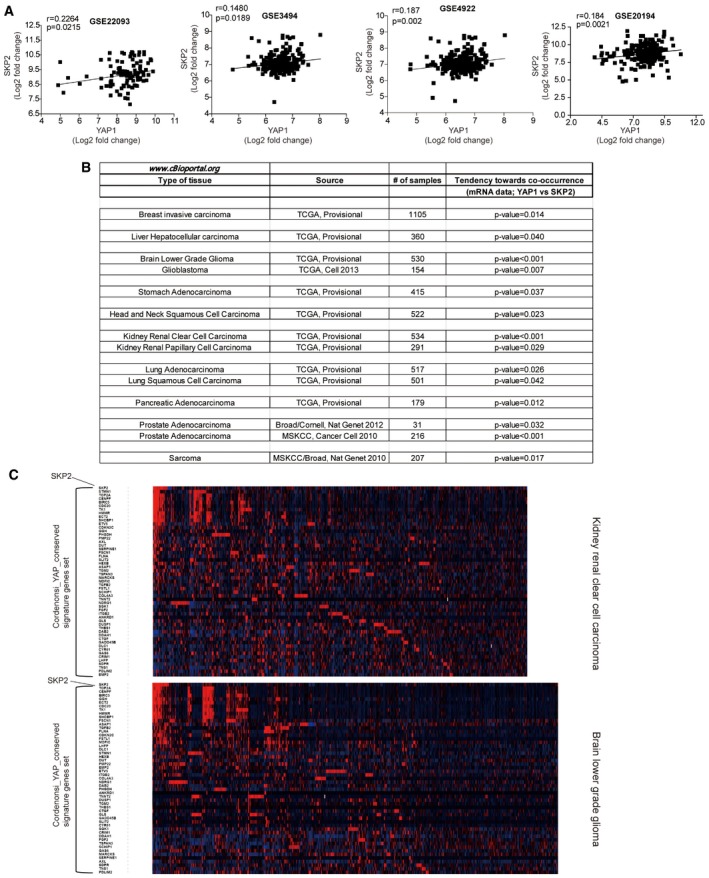
Figure EV5. Positive correlation of YAP and Skp2 expression in breast cancer patients.

- Scatter plot comparing Skp2 and YAP1 mRNA expression in breast cancer patient microarray data. r = Pearson's correlation coefficient.
- Summary and statistical analysis of the correlation between YAP and Skp2 mRNA expression in various cancer patients using cBioPortal.
- Heatmap analysis using cBioPortal showing Skp2 and YAP target gene sets in kidney renal clear cell carcinoma and brain lower‐grade glioma.
