
Figure 8. YAP expression and Skp2 expression are positively correlated in breast cancer patients.
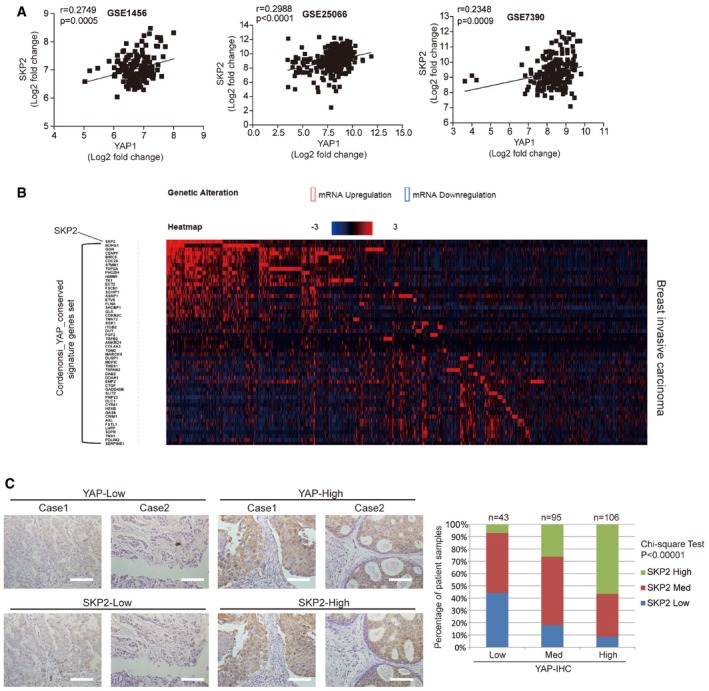
- Heatmap analysis using cBioPortal showing Skp2 and YAP target gene sets in breast invasive carcinoma patients. Data are presented as fold change in Log2.
- Immunohistochemical analysis of tissues used for microarrays (TMA) from breast cancer patients using YAP‐ and Skp2‐specific antibodies. Representative images and statistical analysis of the tissue microarray data are shown. P‐value was calculated using the chi‐square test. Scale bars: 50 μm.