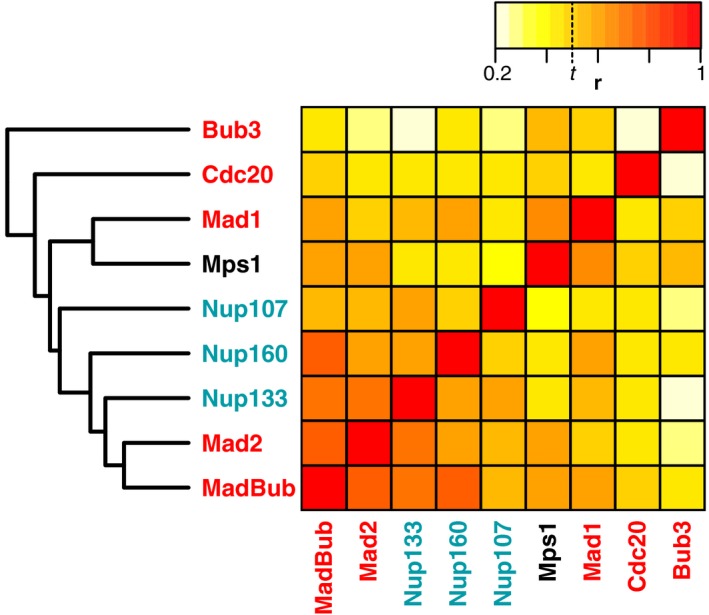
Figure 5. Correlations between proteins of the Nup107‐160 complex and proteins of the SAC.

Heatmap indicating the pairwise Pearson correlation coefficients (r) of the phylogenetic profiles of proteins of the Nup107‐160 complex and of the SAC. The clustering (average linkage) on the left side of this heatmap was also based on these correlations. The indicated threshold t represents the Pearson correlation coefficient for which we found a sixfold enrichment of interacting protein pairs (see Appendix Fig S1).
