-
A, B
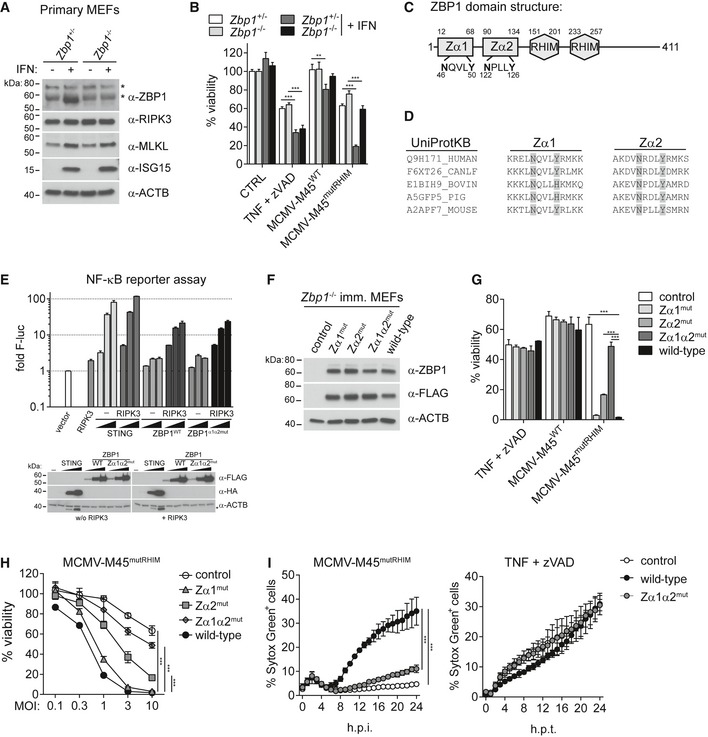
Primary MEFs of the indicated genotypes were treated or not with 100 U/ml of IFN‐A/D for 16 h. (A) Cell extracts were subjected to Western blot analysis using the indicated antibodies. (B) Cells were treated with 30 ng/ml TNF and 20 μM zVAD (TZ) or were infected with the indicated viruses at an MOI of 10. After 16 h, cell viability was assessed using CellTiter‐Glo reagent. Values for untreated cells were set to 100%.
-
C
Domain architecture of mouse ZBP1.
-
D
Conservation of key amino acids in ZBP1's ZBDs. ZBP1 sequences from the indicated species were aligned using Clustal Omega and the sequence context of the conserved asparagine and tyrosine residues involved in Z‐DNA/RNA binding is shown.
-
E
HEK293T cells were transfected with 50 ng NF‐κB firefly luciferase and 25 ng Renilla luciferase reporter plasmids, together with expression vectors for RIPK3 (0.2 ng) and HA‐STING or ZBP1‐3xFLAG (20, 100, 500 ng). Luciferase activity was measured after 24 h, and the ratio of firefly and Renilla luciferase was set to 1 for control cells transfected with empty vector. Cell lysates were analysed for expression of the indicated proteins by Western blot (bottom). Asterisk (*) indicates residual signal from the α‐HA antibody.
-
F–I
Immortalised Zbp1
−/− MEFs were reconstituted with the indicated ZBP1 mutants. (F) Cell extracts were subjected to Western blot analysis using the indicated antibodies. (G and H) Cell viability upon TZ treatment or MCMV infection was assessed as in (B). In (G), an MOI of 10 was used. (I) Cell death was monitored upon infection (MOI = 3) or TZ treatment using an in‐incubator imaging platform (Incucyte) and the dye Sytox Green that stains dead cells.
Data information: Data are representative of three or more independent experiments. Panels (A, B, E and G–I) represent mean ± SD (
n = 3). **
P < 0.01, ***
P < 0.001; two‐way ANOVA. See also Fig
EV1.
Source data are available online for this figure.

