-
A
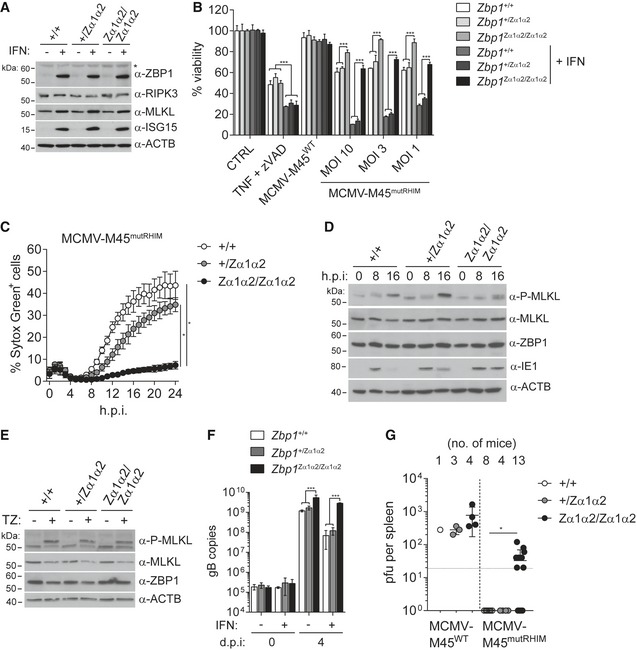
Primary MEFs of the indicated genotypes were treated or not with 100 U/ml of IFN‐A/D for 16 h. Cell extracts were subjected to Western blot analysis using the indicated antibodies. Asterisk (*) indicates a non‐specific band.
-
B
Primary MEFs of the indicated genotypes were treated or not with 100 U/ml of IFN‐A/D for 16 h. Cells were treated with TZ or were infected with the indicated viruses (WT MCMV: MOI = 3). After 24 h, cell viability was assessed using CellTitre‐Glo reagent. Values for untreated control cells were set to 100%.
-
C
Primary MEFs of the indicated genotypes were treated or not with 100 U/ml of IFN‐A/D for 16 h. Cell death was monitored upon infection with MCMV‐M45mutRHIM (MOI = 3) using an in‐incubator imaging platform (Incucyte) and the dye Sytox Green that stains dead cells.
-
D, E
Primary MEFs of the indicated genotypes were treated or not with 100 U/ml of IFN‐A/D for 16 h. Cells were infected with MCMV‐M45mutRHIM at an MOI of 3 for 0, 8 and 16 h (D) or treated for 8 h with TZ (E), and cell lysates were analysed by Western blot.
-
F
Primary MEFs of the indicated genotypes were treated or not with 100 U/ml of IFN‐A/D for 16 h. DNA samples were collected at 0 and 4 days after infection and analysed by qPCR. gB copy numbers were derived from a titration using defined amounts of gB plasmid.
-
G
Zα1α2‐mutant Zbp1 knock‐in (Zbp1
Zα1α2/Zα1α2), heterozygous (Zbp1
+/Zα1α2) and wild‐type (Zbp1
+/+) littermate mice were infected with 2 × 10⁶ pfu MCMV‐M45WT (one experiment) or MCMV‐M45mutRHIM (pooled data from two experiments using independent virus stocks) by intraperitoneal injection. Five days post‐infection mice were sacrificed and viral titres in spleens were determined by plaque assay. Each dot represents one mouse. The dotted horizontal line depicts the detection limit.
Data information: If not indicated otherwise, data are representative of two or more independent experiments. Panels (B, C, F and G) show mean ± SD (
n = 3 in B, C, F). *
P < 0.05, ***
P < 0.001; two‐way ANOVA (panels B, C and F) and Mann–Whitney
t‐test (panel G). See also Fig
EV3.
Source data are available online for this figure.

