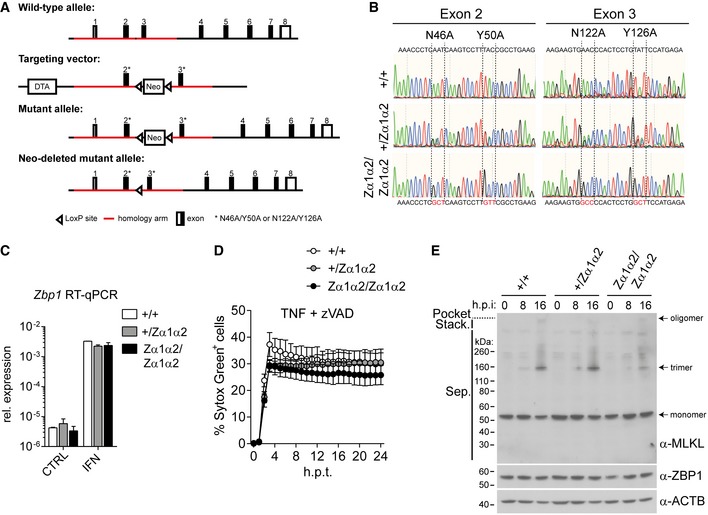
Figure EV3. Validation of ZBP1‐Zα1α2mut knock‐in (related to Fig 3).

- Targeting strategy. See Materials and Methods for further details.
- DNA fragments encompassing exon 2 or 3 were PCR‐amplified from genomic DNA from primary MEFs of the indicated genotypes and were then sequenced.
- Primary MEFs of the indicated genotypes were treated with 100 U/ml IFN‐A/D for 16 h. RNA was extracted, and Zbp1 expression was analysed by RT qPCR.
- Cell death was monitored upon treatment with TZ using an in‐incubator imaging platform (Incucyte) and the dye Sytox Green that stains dead cells.
- Non‐reducing SDS–PAGE and Western blot for MLKL from samples from Fig 3D.
