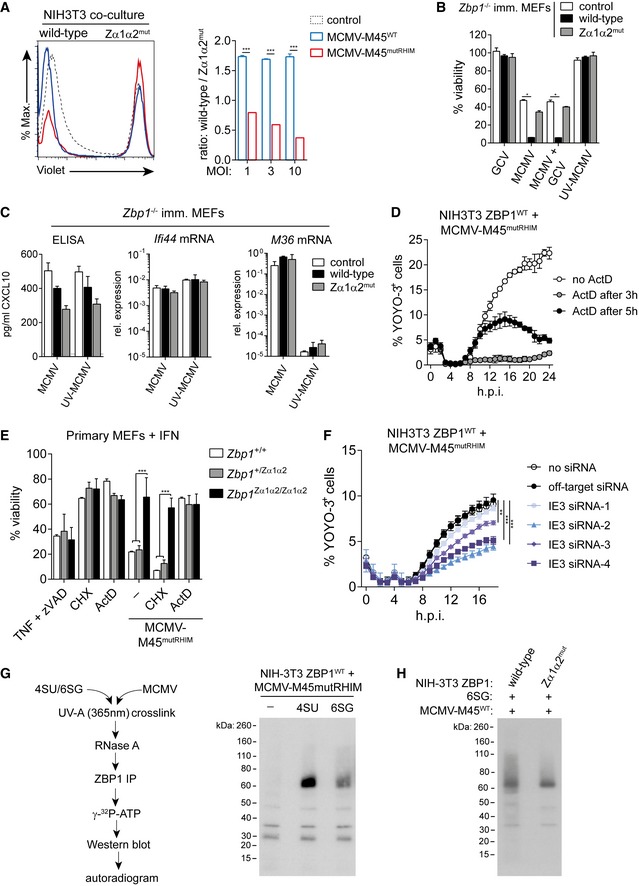
NIH3T3 cells expressing mutant ZBP1 were labelled with CellTrace Violet and were then co‐cultured with cells expressing wild‐type ZBP1 at a 1:2 ratio. Cells were then infected as indicated (MOI 1, 3 and 10) and analysed by flow cytometry after 16 h. Representative FACS histograms (MOI 3) are shown (left), and ratios of wild‐type to mutant cell numbers were calculated (right).
Immortalised Zbp1
−/− MEFs were infected with MCMV‐M45mutRHIM in the presence or not of 50 μM ganciclovir (GCV) or with UV‐treated virus at an MOI of 10. After 16 h, cell viability was assessed using CellTitre‐Glo reagent. Values for untreated control cells were set to 100%.
Using supernatants and RNA samples from (B), CXCL10 protein levels and Ifi44 and M36 mRNA levels were determined by ELISA and RT–qPCR, respectively.
Cell death was monitored upon infection of NIH3T3 cells expressing wild‐type ZBP1 with MCMV‐M45mutRHIM (MOI = 3) using an in‐incubator imaging platform (Incucyte) and the dye YOYO‐3 that stains dead cells. Actinomycin D (ActD) was added (5 μg/ml) at the indicated time points.
Primary MEFs of the indicated genotypes were pre‐treated with 100 U/ml IFN‐A/D for 16 h and were then treated with TZ, CHX (50 μg/ml) or ActD (5 μg/ml) in the presence or absence of MCMV‐M45mutRHIM. Cell viability was assessed as in (B).
NIH3T3 cells expressing wild‐type ZBP1 were transfected with the indicated siRNAs and were then infected with MCMV‐M45mutRHIM. Cell viability was assessed as in (D).
Cells were treated with 100 μM 4SU or 6SG and infected with MCMV‐M45
mutRHIM for 8 h. Binding of newly synthesised RNA to ZBP1 was analysed by PAR‐CLIP (see
Materials and Methods). Shown is an autoradiogram after electrophoresis and blotting of ZBP1 immunoprecipitates.
NIH3T3 cells expressing wild‐type or mutant ZBP1 were treated with 100 μM 6SG and were infected with MCMV‐M45WT at an MOI of 3 for 8 h. Binding of ZBP1 to RNA was analysed as in (G).
Data information: Data are representative of three or more independent experiments. Panels (A–F) show mean ± SD (
= 3). *
< 0.001; two‐way ANOVA. See also Fig
.

