
Figure EV2. Distribution of distances between 16 pairs of chromatin loci in the absence of Zeocin.
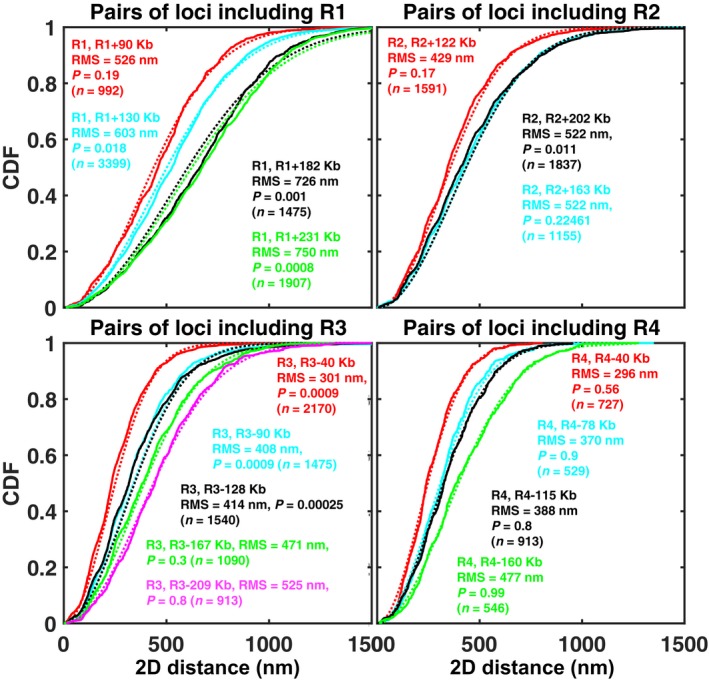
Each panel corresponds to a different reference locus (R1, R2, R3, or R4), as indicated. Each solid curve is the empirical cumulative distribution function (CDF) for the pair of loci indicated in the same‐colored legend. The dotted curve of the same color shows the function , where , is the experimentally measured root‐mean square (RMS) distance, measured between the two loci, as indicated in the legend. F is the CDF expected for a Gaussian distribution of the distance vector between the two loci, as predicted by an ideal chain model (see Appendix Supplementary Methods). The P‐value indicates the result of a Kolmogorov–Smirnov test comparing the experimentally measured CDF to F. For nine out of 16 pairs, the measured CDF is statistically undistinguishable from the Gaussian model (P > 0.05), for two more, the difference is only marginally significant (P > 0.01). The number of cells for each pair, n, is indicated.