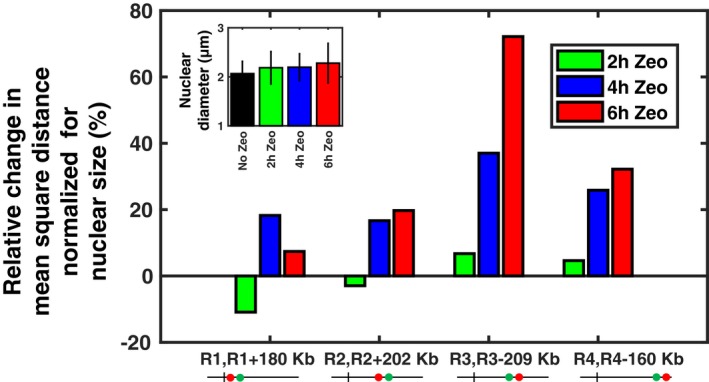
Figure EV3. Prolonged Zeocin treatment increases intrachromosomal distances.

Relative change in mean square distances between pairs of loci (in %), as in Fig 3B, but after normalization by the mean nuclear diameter for each Zeocin exposure, as shown in the inset (diameter was measured in cells with fluorescently tagged nuclear envelope; error bars show standard deviations).
