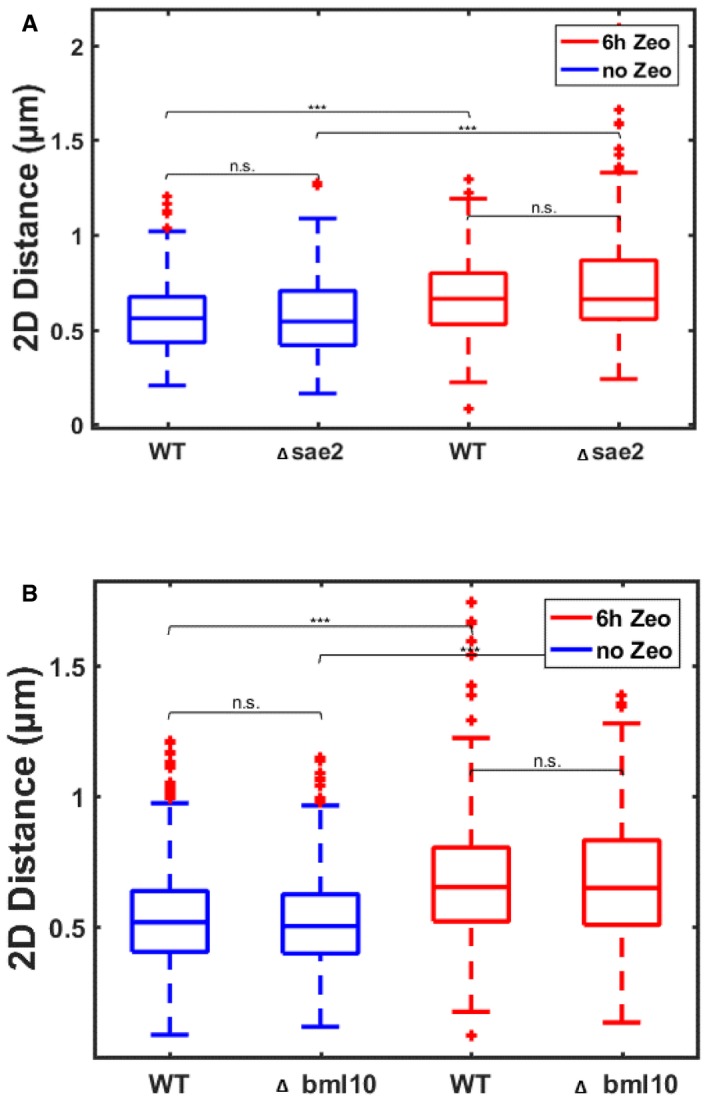
Boxplots show the distributions of 2D intrachromosomal distances between loci R3 and R3‐167 kb (see Fig
1B) in a deletion mutant of Sae2 (Δsae2) as compared to wild‐type cells (WT), in untreated cells (blue) or in cells exposed to Zeocin for 6 h (red).
Same as (A) but for the deletion mutant of Blm10 (Δblm10).
Data information: The horizontal line at the center of each box indicates the median value, the bottom and top limits indicate the lower and upper quartiles, respectively. The whiskers indicate the full range of measured values, except for outliers, which are shown as red crosses. Brackets indicate the results of a Wilcoxon rank‐sum test on pairs of distributions, with “n.s.” for not significant (
P > 0.05), and *** for
P < 0.001.

