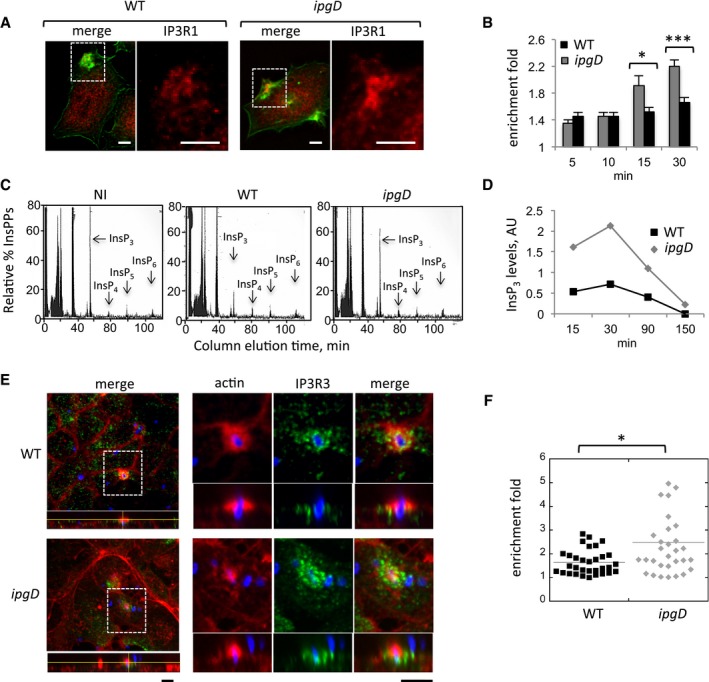
Figure 1. IpgD down‐regulates IP3R recruitment and InsP3 levels during Shigella invasion.

- Representative confocal fluorescence images of cells challenged with the indicated bacterial strains for 15 min at 37°C and processed for immunofluorescence staining. The right panels are higher magnifications of the corresponding boxed inset. Red: IP3R1; green: actin. Scale bar = 5 μm.
-
The enrichment fold of IP3R1 at invasion foci ± SEM was determined at the indicated time points (Materials and Methods). WT Shigella: solid bars; ipgD mutant: gray bars.N = 3,200 foci. Wilcoxon test, *P = 0.0220; ***P = 2.7 × 10⁻¹⁵.
- Cells were labeled with H3‐myo‐inositol and challenged with the indicated bacteria for 30 min at 37°C. IPPs were analyzed by anion‐exchange chromatography as described (Leyman et al, 2007). InsPP elution profiles are shown. Note the decrease in InsP3 levels during infection with WT Shigella.
- The ratio of InsP3 relative to initial levels in uninfected cells was determined from measurements as in panel (C) in extracts from cells challenged with WT Shigella (black squares) or the ipgD mutant (gray diamonds). The time post‐infection is indicated.
- Polarized TC7 cell monolayers were challenged with the indicated bacterial strains for 20 min at 37°C and processed for immunofluorescence staining. The IP3R3 panel is a higher magnification of the corresponding boxed inset. Green: IP3R3; red: actin; blue: bacterial LPS. Scale bar = 5 μm.
- The enrichment fold of IP3R3 at invasion foci was determined for the indicated strains. Each mark represents a determination. N = 2, Wilcoxon test, *P = 0.033.
