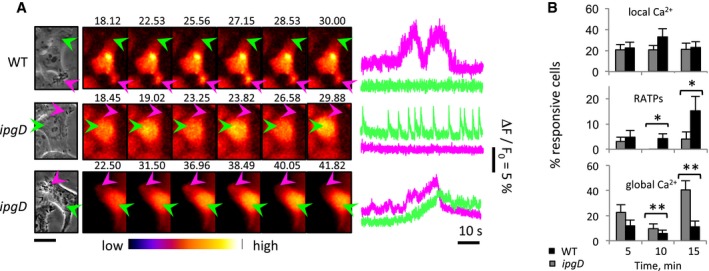
Figure 2. IpgD shapes local and global Ca2+ responses during Shigella invasion.

- HeLa cells were loaded with Fluo‐4‐AM and challenged with the indicated bacterial strains. Left: Phase‐contrast images. Center: Time series of Fluo‐4 fluorescence of the corresponding fields depicted with the indicated color code. The elapsed time from the start of acquisition is indicated in seconds. Arrowheads: invasion foci (purple); control area (green). Scale bar = 5 μm. Right: Traces of Ca2+ variations in area pointed to by the arrow with the corresponding color in left panels. From top to bottom, these traces are representative of local RATPs, local fast spiking, and global responses.
- Percentage of cells ± SEM showing local responses, RATPs, or global Ca2+ responses induced by the ipgD mutant (gray bars) or WT Shigella (black bars). N = 4, > 60 cells for each determination. Wilcoxon test, *P < 0.05; **P < 0.01.
