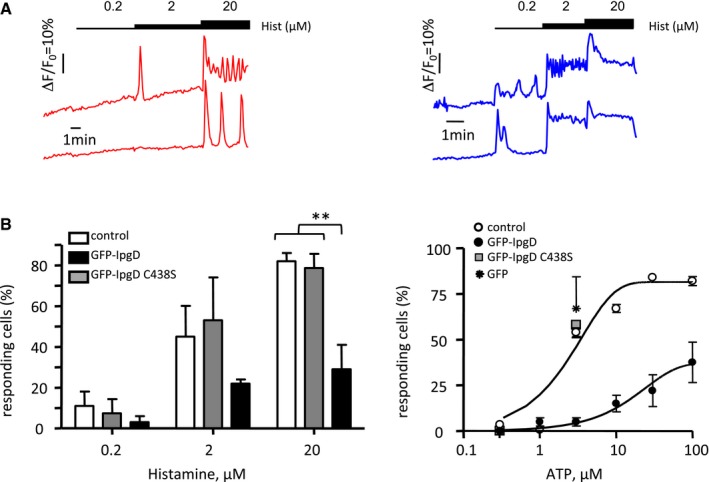
Figure EV4. GFP‐IpgD‐expressing cells show decreased responses to Ca2+ agonists.

- Representative traces of cells transfected with GFP‐IpgD (red traces) or catalytically inactive GFP‐IpgDC438S (blue traces), loaded with Fura‐2‐AM, and stimulated with the indicated concentrations of histamine. Changes in the ratio of Fura‐2 fluorescence intensity (∆R) were calculated relative to the resting ratio value (R 0) as ∆R/R 0.
- The percentage of cells responding to the indicated agonist concentration was scored and expressed as an average ± SEM. The values are representative of 3–15 determinations in three independent experiments. Cells were transfected with the indicated constructs. Control: non‐transfected cells. Unpaired t‐test, **P = 0.0081.
