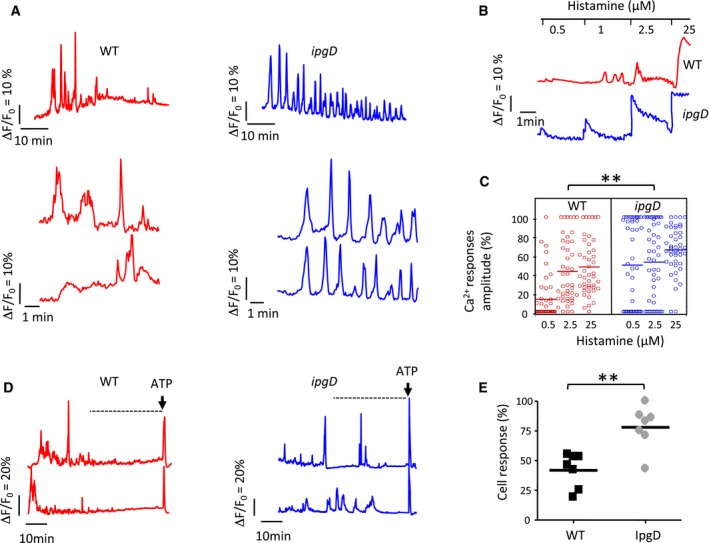
Cells were loaded with the Ca
2+ indicators Fura‐2‐AM (A–C) or Fluo‐4‐AM (D, E) and challenged with WT
Shigella (red) or the
ipgD mutant (blue). Samples were subjected to Ca
2+ imaging (
Materials and Methods). Changes in the ratio of Fura‐2 fluorescence intensity (∆
R) were calculated relative to the resting ratio value (
R
0) as ∆
R/
R
0.
Representative traces of single cell global Ca2+ responses are shown for challenge with the indicated strains.
Representative traces of infected HeLa cells stimulated with histamine at the indicated concentrations at 90 min post‐infection.
Amplitude of Ca2+ responses relative to the maximal response upon stimulation at the indicated histamine concentrations of cells infected with the indicated bacteria for 90 min. Wilcoxon test, **P < 0.01.
Representative traces of global Ca2+ responses are shown for polarized TC7 cells. The arrow indicates stimulation with 30 μM ATP.
Dot plot representing the % of polarized TC7 cells challenged with the indicated bacterial strain, showing global Ca2+ responses during a 30‐min period, 30 min following infection, and prior to ATP stimulation (dotted line in panel D) (N = 7, > 200 cells). Wilcoxon test: **P = 0.007.

