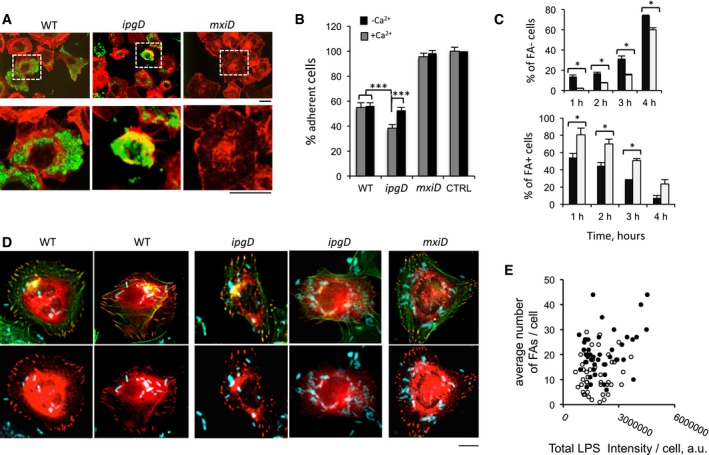
Figure EV5. The ipgD mutant induces cell retraction and detachment.

- Representative micrographs of cells challenged for 6 h with the indicated bacterial strains and processed for immunofluorescence staining. F‐actin: red; bacteria: green. Scale bar, 5 μm.
- The number of remaining adherent cells was scored (Materials and Methods) and expressed as average percentage ± SEM relative to control non‐infected cells. Challenge in RPMI medium (gray bars) or in RPMI containing 2 mM EGTA (black bars). The values are representative of at least 200 cells scored in 4 independent experiments. t‐test, ***P < 0.001.
- Cells were transfected with GFP‐talin prior to bacterial challenge. The average percentage ± SEM of cells devoid of FAs (FAs−) or showing prominent FAs (FAs+) is shown for the indicated bacterial strain and infection time. Wilcoxon test, *P < 0.05. Each determination was performed on at least 200 cells in three independent experiments.
- Representative micrographs of cells challenged for 1 h with the indicated bacterial strains and processed for immunofluorescence staining. GFP‐talin: red; actin: green; bacteria: cyan. Scale bar, 5 μm.
- The number of automatically detected focal adhesions per cell is plotted against the bacterial load using LPS‐fluorescence intensity. Cells challenged with WT (solid circles) and ipgD mutant (empty circles). No correlation is observed between the bacterial load and the average number of FAs per cell.
