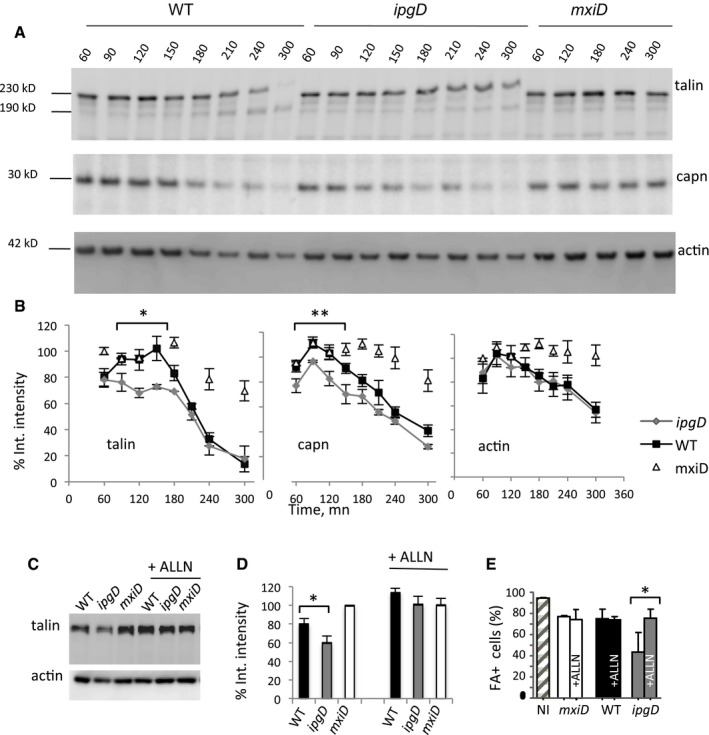
Figure 7. IpgD delays Ca2+‐dependent calpain activation and talin cleavage during Shigella invasion.

- Cells were infected with bacterial strains for the time indicated in minutes. Infected‐cell lysates were analyzed by Western blotting using antibodies directed against the indicated proteins. A representative experiment is shown. Migration of the molecular weight markers is indicated.
- The average integrated intensity of bands ± SEM corresponding to the indicated proteins was determined from at least three independent experiments and expressed as a percentage of that determined for control cells challenged with the non‐invasive mxiD mutant. Cells were infected for the indicated incubation time with wild‐type Shigella (black squares), the ipgD mutant (gray diamonds), or the mxiD mutant (empty triangles) strains. Statistical tests performed for values between 90 and 180 min. ANCOVA test, *P = 0.01122. **P = 0.008.
- Cells were pre‐treated with the calpain inhibitor ALLN at a final concentration of 10 μM for 1 h and challenged with bacteria for 1 h. Cell lysates were analyzed by anti‐talin or anti‐actin Western blotting. A representative experiment is shown.
- The average integrated intensity ± SEM of the talin band was determined in independent experiments for the indicated bacterial strain. N = 3, Wilcoxon test, *P < 0.05.
- The relative percentage of cells challenged with the indicated strains and presenting large FAs ± SEM is shown. n > 30 cells, N = 2. Wilcoxon test, *P < 0.05.
Source data are available online for this figure.
