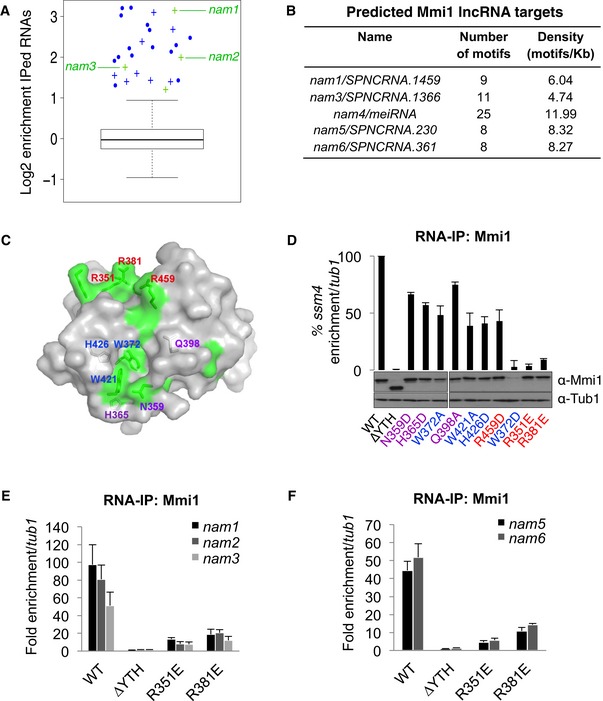
Figure 1. Extensive identification of Mmi1 RNA targets by combining RNA‐IP sequencing and computational approaches.

-
ABox plot of the enrichment of the RNAs identified by Mmi1 RNA‐IPs coupled to high‐throughput sequencing. The log of the average enrichments obtained from two independent RNA‐IPs is plotted. The enrichment is relative to the no antibody RNA‐IPs conducted in parallel with Mmi1 RNA‐IPs. The boxes represent the median and the upper and lower quartiles (25% and 75%). The whiskers extend to 1.5 times the interquartile range from the box. The mRNAs and lncRNAs enriched at least twofold in both Mmi1 RNA‐IPs are shown in blue and green, respectively. Crosses represent newly identified Mmi1 targets and dots known targets.
-
BLncRNAs predicted to be targets of Mmi1 with a high confidence by our computational approach.
-
CSurface representation of Mmi1 YTH domain. Area corresponding to conserved residues (according to the alignment shown in Fig EV2A) and located at the surface are highlighted in green. Mutated residues in Mmi1 YTH domain are indicated in blue for the ones located within the aromatic cage, in purple for the ones surrounding the cage, and in red for the rest.
-
DRNA‐IPs showing the impact of Mmi1 YTH domain point mutations on Mmi1 binding to ssm4 mRNA. The lower part shows a Western blot monitoring the protein level of WT and mutant Mmi1 proteins in the cells used for the RNA‐IPs. Loading was monitored using an anti‐Tub1 (tubulin) antibody.
-
E, FRNA‐IPs showing the YTH‐dependent association of Mmi1 with the lncRNAs identified in (A) and (B).
