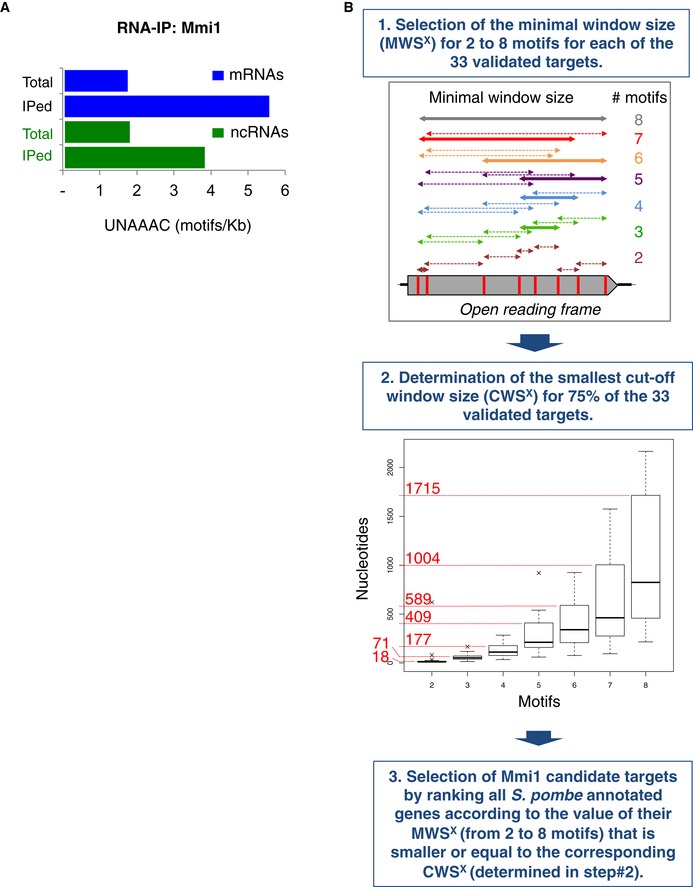
Diagram of the genomewide computational approach used to predict Mmi1 targets. In step 1, a hypothetical open reading frame that has eight UNAAAC motifs in its sequence is shown as an example. The double‐headed arrows indicate all possible windows containing from two to eight motifs. The thick double‐headed arrows correspond to the windows yielding the minimal window size (MWS) from two to eight motifs. In step 2, each box plot represents the MWS
x calculated for all of the validated targets. The boxplots were produced using the “boxplot” function in R with default parameters: the boxes represent the median and the upper and lower quartiles (25% and 75%); and the whiskers attempt to capture the extreme values, but extend to at most 1.5 times the interquartile range from the box, in which case any outliers beyond this range appear as crosses. The numbers in red represent the cutoff window size (CWS) for two to eight motifs. See the
Materials and Methods for more details.

