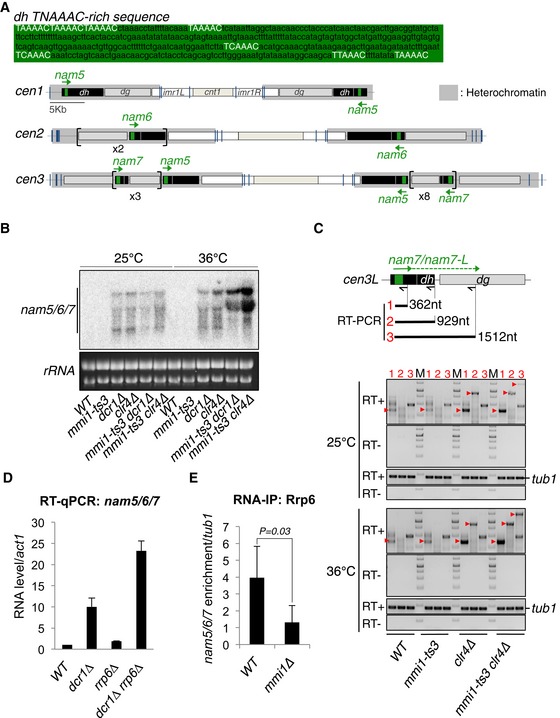
Upper part, TNAAAC‐rich sequence present in nam5, 6, and 7 lncRNAs. Lower part, schematic representation of three S. pombe centromeres showing the different pericentromeric DNA repeats susceptible to produce nam5, 6, and 7 (green arrows).
Northern blot showing the level of nam5/6/7 lncRNA population in mmi1‐ts3, dcr1∆, clr4∆ single mutant cells, and in mmi1‐ts3 dcr1∆ and mmi1‐ts3 clr4∆ double mutant cells, at the permissive (25°C) and restrictive (36°C) temperatures.
RT–PCRs monitoring the accumulation of nam7 lncRNAs and nam7‐L read‐through transcripts, in the same cells and conditions as in (B). Red arrow heads point to the expected PCR products while the other bands correspond to non‐specific PCR products. From the scheme and the agarose gels: black arrows, primers used for the three different reverse transcriptions; black lines and red numbers, expected PCR products of the three different RT–PCRs; M, DNA ladder markers; tub1, tubulin control.
RT–qPCRs showing the levels of nam5/6/7 lncRNA population in the double mutant rrp6∆ dcr1∆ cells, relative to the single mutant rrp6∆ and dcr1∆ cells.
RNA‐IPs showing that Rrp6‐Myc13 binds to nam5/6/7 lncRNAs in a Mmi1‐dependent manner. P‐value was calculated using a two‐tailed Student's t‐test.
Data information: Average fold enrichment is shown with error bars that indicate mean average deviations (
= 3) for (D, E).

