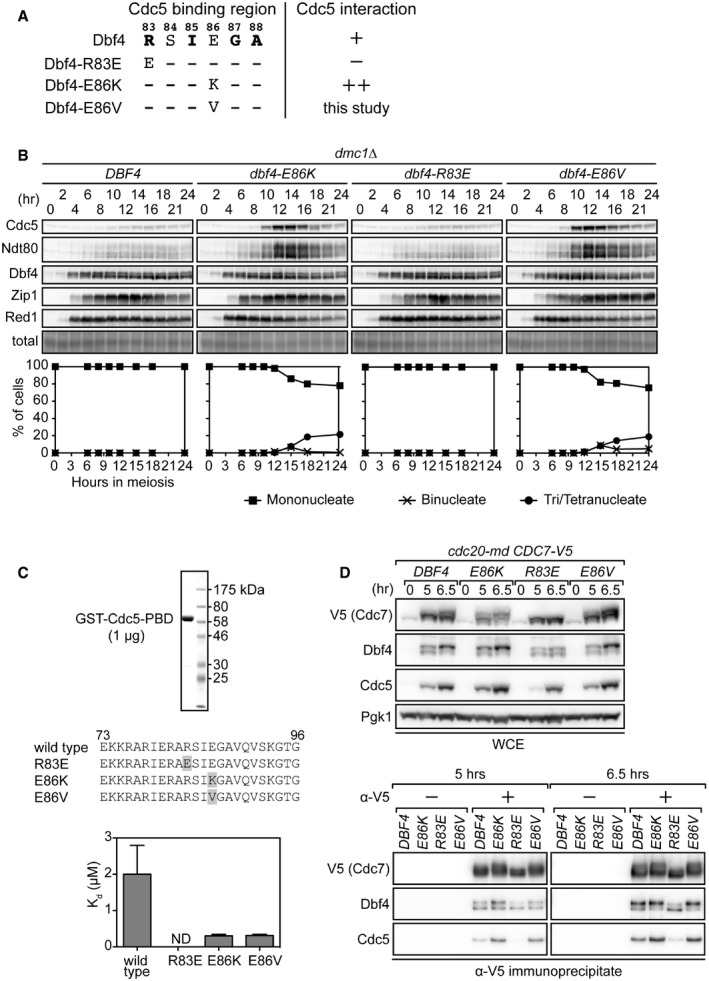
Figure 1. An enhanced interaction between DDK and Cdc5 suppresses pachytene arrest.

- Schematic depicting the Cdc5 binding region of Dbf4. Residues in bold are essential for the interaction. +, wild‐type interaction; −, no interaction detected; ++, enhanced interaction.
- Strains were induced to synchronously enter meiosis. At the indicated time points, cells were harvested for detection of proteins by immunoblotting (panels) and determination of cell cycle kinetics by DAPI staining of nuclei (graphs). Induction of Ndt80 and Cdc5 serves as a marker for pachytene exit. Total, total protein levels (Ponceau S staining). Mononucleate cells have not completed any nuclear divisions, binucleate cells have only completed the first nuclear division (anaphase I), and tri/tetranucleate cells have completed both nuclear divisions (anaphase I and II).
- A fragment of Cdc5 containing the PBD was N‐terminally GST‐tagged and purified to near homogeneity, as determined by Coomassie staining (upper panel). Various Dbf4 peptides corresponding to sequences spanning the Cdc5 binding region were synthesized with a fluorescein tag (middle panel). Mutations are highlighted in gray. Measurements obtained from fluorescence polarization assays depicted in Appendix Fig S2B were used to calculate the dissociation constants (K d) for each peptide‐PBD interaction (lower graphs). ND, not determined due to lack of detectable interaction (see Appendix Fig S2B).
- Strains were induced to synchronously enter meiosis. Cells harvested at the indicated time points were used to examine the interaction between DDK and Cdc5 by immunoprecipitating Cdc7‐V5 using anti‐V5 antibody. WCE, whole‐cell extract. “−” and “+” indicate the exclusion and inclusion of antibody for IP, respectively, with the no antibody condition serving as a negative control.
