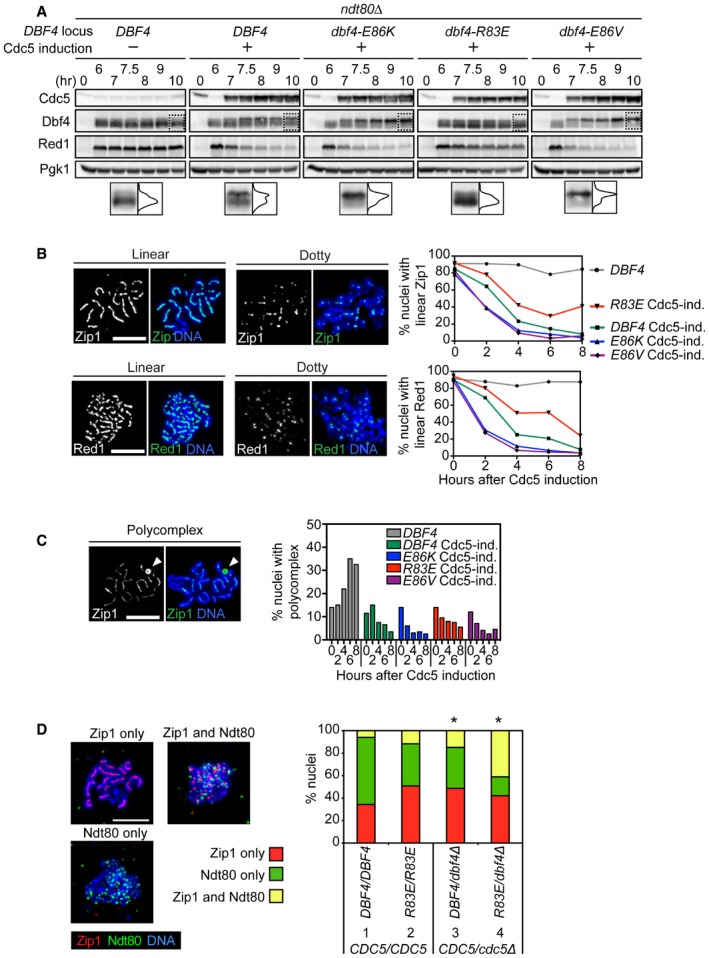
Figure 4. Cdc5‐dependent phosphorylation of Dbf4 drives SC disassembly.

- Strains were induced to synchronously enter meiosis. At 6 h, β‐estradiol was added to induce Cdc5 production. Proteins were detected as in Fig 1B. Images within the dotted boxes are expanded, and the signal quantified to illustrate the distribution of Dbf4 for that lane. The horizontal axis represents the percentage of signal, and the vertical axis corresponds to the source of that signal. The total area under the curve is set to be equal between strains. “−” and “+” denote the absence or presence of an inducible CDC5 allele at the URA3 locus, respectively.
- ndt80Δ strains in the BR1919 background were transferred to sporulation media. At 20 h, β‐estradiol was added to induce Cdc5 production (confirmed in Fig EV3B). Cells were harvested, and meiotic chromosomes were spread for immunofluorescence microscopy at 2‐h intervals after addition of β‐estradiol. Representative images depicting the criteria for categorization of nuclei are shown (panels). Nuclei were categorized according to these criteria (graphs).
- Spread meiotic chromosomes were prepared as in (B). Cells are from the same cultures as (B). A nucleus is shown with the polycomplex depicted by a white arrowhead (panels). Nuclei were categorized according to this criterion (graphs).
- Strains in the BR1919 background containing NDT80‐6xHA were transferred to sporulation media. At 16 h, spread meiotic chromosomes were prepared as in (B). Representative images depicting the criteria for categorization of nuclei are shown (panels). Nuclei were categorized according to these criteria (graphs). *P < 0.05 (chi‐squared test), in comparison with the wild‐type ratio positive for both Zip1 and Ndt80.
