
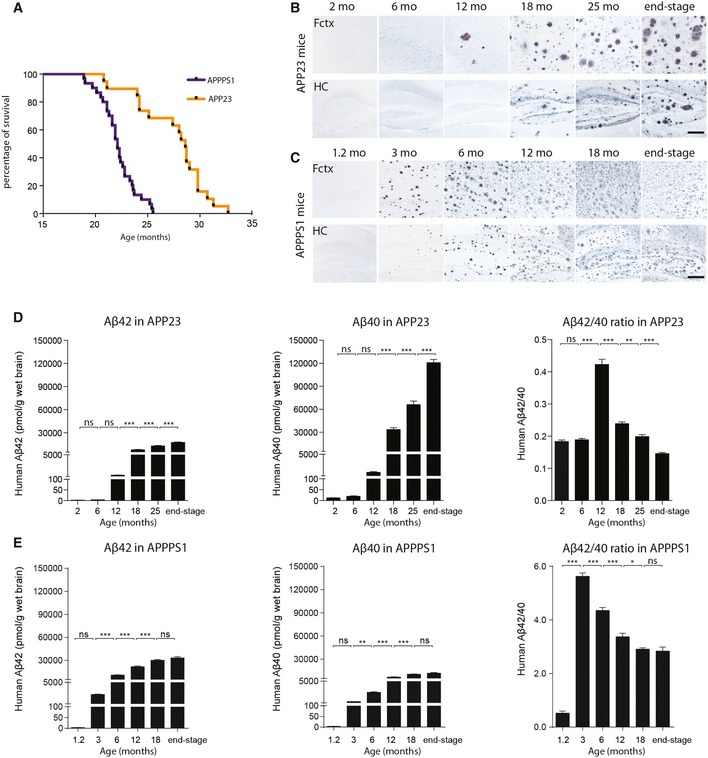
Figure 1. Age‐related changes in cerebral Aβ load in APP23 and APPPS1 tg mice.
-
ASurvival curves of APP23 (n = 19; males) and APPPS1 (n = 29; males) mice were generated by following cohorts of both strains from 15 months of age until the mice were sacrificed due to deteriorating health. Median survival time for APP23 mice was 28.6 months, and for APPPS1 mice 22.1 months (Chi square = 29.63, df = 1; P < 0.001).
-
B, CAβ immunostaining (black) combined with Congo red staining (red) shows Aβ deposits in the neocortex (upper row) and hippocampus (lower row) of male APP23 mice (B) and male APPPS1 mice (C) at different ages. End stage was defined as the point at which mice had to be terminated due to poor health (n = 5–9 male mice/group; representative images from each time point are shown). Scale bars: 200 μm.
-
D, EAβ40, Aβ42, and Aβ42/Aβ40 ratio in total brain homogenates of separate animal cohorts (n = 7–11 male mice per group) for APP23 mice (F 5,56 = 339.7, F 5,56 = 332.8, F 5,56 = 145.5, respectively) (D) and APPPS1 mice (F 5,41 = 168.4, F 5,41 = 257.2, F 5,41 = 182.4, respectively) (E) measured by immunoassays (mean ± SEM); ANOVA followed by post hoc Bonferroni test: *P < 0.05, **P < 0.01, ***P < 0.001, ns = not significant.