
Figure 7.
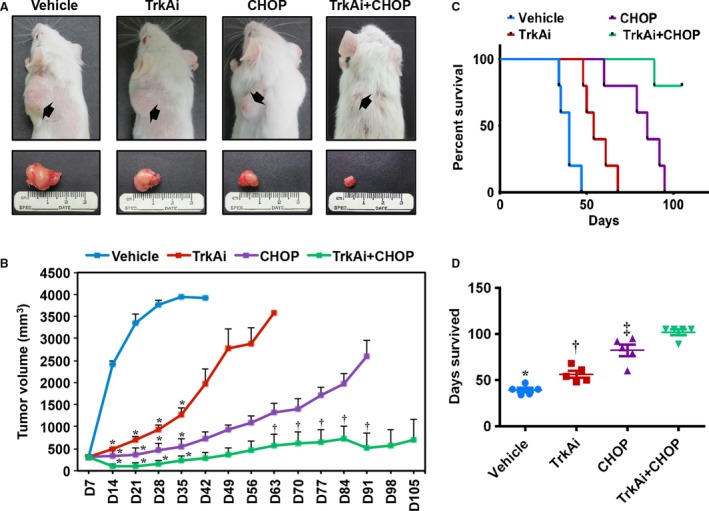
Effects of inhibition of TrkA on NPM‐ALK + T‐cell lymphoma growth in vivo. (A) Tumor sizes of the SR‐786 subcutaneous xenografts treated with vehicle, TrkAi, CHOP, or CHOP+TrkAi. Tumors are depicted before (upper panel) and after (lower panel) dissection. Whereas treatment with TrkAi or CHOP alone decreased tumor sizes, this effect was much more pronounced when mice were simultaneously treated with TrkAi and CHOP. (B) Changes in tumor volume over a period of 105 days in the vehicle‐, TrkAi‐, CHOP‐, CHOP+TrkAi‐treated mice. Data represent means ± SE (*P < 0.0001; † P < 0.05 vs. vehicle‐treated group). (C) Kaplan–Meier survival curve demonstrates significant differences in the survival of the mice treated with vehicle, inhibitor, CHOP, and CHOP+TrkAi. All treatment groups were statistically significant vs. control group in terms of survival (P < 0.001). CHOP treatment was slightly superior to using TrkAi alone (P < 0.05), but CHOP+TrkAi was far superior to TrkAi or CHOP alone (P < 0.005). (D) Scatter plot shows median survival of animals treated with various agents. Data shown represent means ± SE (*P < 0.05 vs. TrkAi, P < 0.0001 vs. CHOP and CHOP+TrkAi; † P < 0.05 vs. CHOP, P < 0.0001 vs. CHOP+TrkAi; ‡ P < 0.05 vs. CHOP+TrkAi).