
Figure 8.
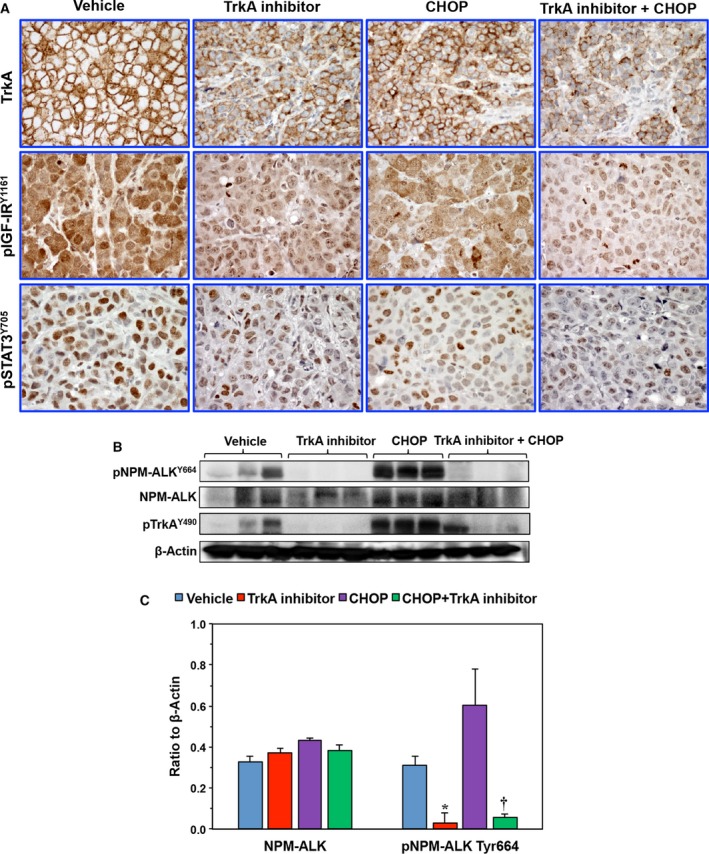
Analysis of lymphoma xenograft tumors. (A) IHC shows high levels of expression of TrkA, pIGF‐IR, and pSTAT3 in the tumors from control mice. Whereas the TrkAi decreased the expression of TrkA, CHOP alone had lesser effects. Combining TrkAi and CHOP induced remarkable downregulation of TrkA levels in the tumors. In addition, the combination regimen remarkably reduced the levels of pIGF‐IR and pSTAT3. Original magnification is × 400. (B) Because of the lack of adequate antibodies to detect pTrkA and pNPM‐ALK expression using IHC, mouse tumors were subjected to protein extraction and WB assay to analyze pNPM‐ALK expression. CHOP alone failed to decrease the levels of pTrkA or pNPM‐ALK in two representative tumors. In contrast, TrkAi alone or in combination with CHOP caused a marked reduction in pTrkA and pNPM‐ALK levels. β‐Actin shows equal protein loading. (C) Densitometry of the NPM‐ALK and pNPM‐ALK bands is shown (*P < 0.05 and † P < 0.01 vs. control). Data shown represent means ± SE of three different xenograft tumors (MW: NPM‐ALK and pNPM‐ALK, 80 kDa; pTrkA, 140 kDa).