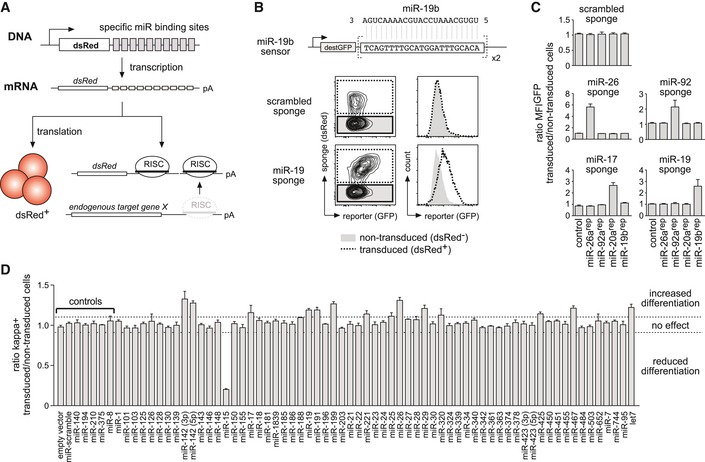
Schematic illustration of the experimental setup to induce functional miRNA knockdown by miRNA sponges.
Derepression of a fluorescent miRNA sensor by a miRNA sponge. Pre‐B cells expressing a GFP‐based sensor for miR‐19b (upper lane) were transduced with a scrambled sponge as a control or with a sponge targeting the miR‐19 family (both expressing dsRed as a marker). Contour plots as well as histograms depict the GFP fluorescence distribution of the dsRed‐negative, non‐transduced population, and the dsRed‐positive, sponge‐expressing cells.
Bar graphs representing an experiment as in (B), comprising five miRNA reporter constructs and five different miRNA sponges. Depicted values represent the ratio of GFP MFI of transduced compared to non‐transduced cells within the same sample. Data show mean + SD and are representative of four independent experiments yielding similar results.
Pre‐B cells retrovirally transduced with the respective sponge constructs were cultured without IL‐7 for 60 h to induce their differentiation into immature B cells. Differentiation was quantified by FACS analysis for surface expression of the mature B cell receptor (as measured by kappa light chain expression). An empty vector, a scrambled sponge, and sponges targeting miRNAs not expressed in early B cells were used as controls, respectively. Individual bars show the ratio of percentage of kappa‐positive cells comparing transduced and non‐transduced cells within one sample, as a mean (+ SD) of at least three independent experiments. Dashed lines mark the region in which miRNA sponges were defined as having no effect (ratio of 0.9–1.1). MFI, mean fluorescence intensity.