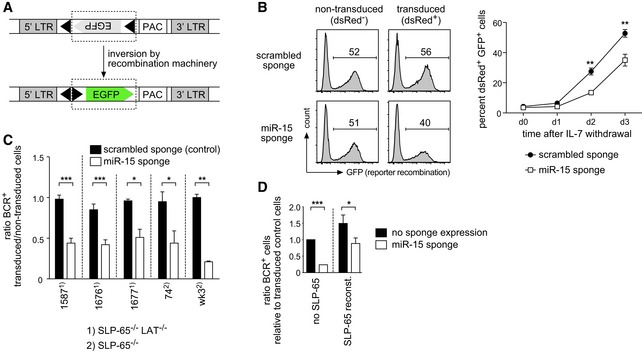
Schematic overview of the fluorescent reporter for kappaLC recombination. An inverted EGFP cDNA flanked by kappaLC recombination signal sequences (black triangles) is expressed from a retroviral LTR. Upon Rag1/2‐mediated recombination, the GFP cassette is inverted, giving rise to GFP+ cells. PAC, puromycin resistance gene.
Sequestering miR‐15 family members reduces the activity of the recombination machinery in pre‐B cells. Wk3 cells expressing the reporter as shown in (A) were transduced with the scrambled sponge as a control or the miR‐15 sponge and cultured without IL‐7 to induce light chain recombination. The histogram plots depict the GFP expression in the non‐transduced, dsRed− population and the transduced, dsRed+ population of a representative experiment on day 3. Numbers indicate the percentage of cells in the respective gate. The line graph shows the percentage of GFP+ cells in the dsRed+ population over the course of 3 days (mean ± SD of three independent experiments). Statistical significance was calculated by a paired t‐test; **P < 0.01.
Different pre‐B cell lines (SLP‐65−/− or SLP‐65−/−LAT−/− as indicated) including the wk3 line used throughout the study transduced with vectors encoding the scrambled sponge or the sponge targeting the miR‐15 family were cultured without IL‐7 to induce differentiation. After 60–72 h, cells were analyzed for expression of the mature BCR (as measured by anti‐kappaLC and anti‐muHC antibodies). Individual bars depict the ratio in the percentage of BCR+ cells comparing transduced and non‐transduced cells. Groups were compared by a paired t‐test; ***P < 0.001, **P < 0.01, *P < 0.05. Data represent means ± SD of three independent experiments.
Wk3 pre‐B cells were co‐transduced with vectors encoding the miR‐15 sponge (dsRed as a marker) and SLP‐65 (GFP as a marker) or the scrambled sponge and the empty vector as a control. After 72 h, non‐transduced, dsRed+, GFP+, and dsRed+GFP+ cells were analyzed for expression of the mature BCR. Individual bars depict the ratio in the percentage of BCR+ cells comparing the miR‐15 sponge and/or SLP‐65‐expressing cells with cells expressing their respective control constructs (means ± SD of three independent experiments). Groups were compared by a paired t‐test; ***P < 0.001, *P < 0.05.