-
A
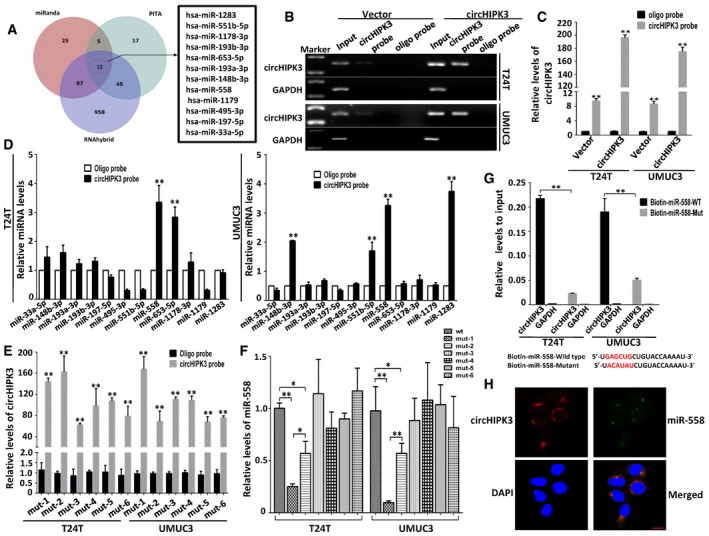
Schematic illustration showing overlapping of the target miRNAs of circHIPK3 predicted by miRanda, PITA, and RNAhybrid.
-
B, C
Lysates prepared from T24T and UMUC3 cells stably transfected with circHIPK3 or vector were subject to RNA pull‐down assay and tested by RT–PCR (B) and real‐time PCR (C). Relative level of circHIPK3 was normalized to input. GAPDH was used as negative control. Data are mean ± SEM, n = 3. **P < 0.01 versus oligo probe (Student's t‐test).
-
D
The relative level of 12 miRNA candidates in the T24T and UMUC3 lysates was detected by real‐time PCR. Multiple miRNAs can be pulled down by circHIPK3, and miR‐558 was pulled down by circHIPK3 in two cell lines. Data are mean ± SEM, n = 3. **P < 0.01 versus vector (Student's t‐test).
-
E
Six binding sites of miR‐558 on circHIPK3 were mutated and transfected into T24T and UMUC3 cells, respectively. The efficacies of circHIPK3 probe on the six mutants were tested by real‐time PCR. Relative level of circHIPK3 was normalized to input. Data are mean ± SEM, n = 3. **P < 0.01 versus oligo probe (Student's t‐test). mut‐1, mut‐2, etc. represent mutant of binding site1, mutant of binding site2, etc.
-
F
The pull‐down efficacies of six mutated circHIPK3 on miR‐558 were tested by real‐time PCR. Relative level of miR‐558 was normalized to input. Data are mean ± SEM, n = 3. **P < 0.01 versus wt group (Student's t‐test).
-
G
The biotinylated wild‐type miR‐558 (Bio‐miR‐558‐WT) or its mutant (Bio‐miR‐558‐Mut) was transfected into T24T and UMUC3 cells. After streptavidin capture, circHIPK3 levels were quantified by real‐time PCR, and the relative immunoprecipitate (IP)/input ratios are demonstrated. GAPDH was used as negative control. Biotin‐coupled miR‐558 wild‐type and mutant sequences are shown below. Data are mean ± SEM, n = 3. **P < 0.01 versus wild type (Student's t‐test).
-
H
Fluorescence in situ hybridization (FISH) showing the co‐localization between circHIPK3 and miR‐558 in T24T cells. CircHIPK3 probes were labeled with Cy3. Locked nucleic acid miR‐558 probes were labeled with Dig. Nuclei were stained with DAPI. Scale bar, 10 μm.